
A relationship chart is a graphical representation of a person’s lineage. It gives crucial information for determining the connection between relatives. This is an important record that explains to the family where they came from. As a result, you may wish to develop a connection family diagram to preserve your family history for future generations. In this post, we will demonstrate the simplest approach to making a connection chart and offer examples for your personal usage.
How to Create a Relationship Chart
There are various ways to create a family relationship chart. You can do it conventionally with a record book, as well as with the help of visual tools like GitMind. This is a free web-based tool designed to help users create a family chart, mind maps, diagrams, and a lot more. Aside from that, it is loaded with useful options for customizing charts that include five different map layouts, themes, color, and text formatting. To learn how to use this program, follow the easy guide below.
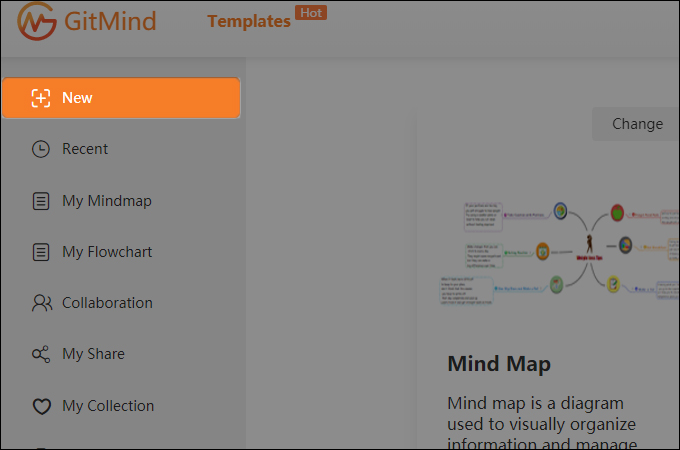
Download- Search GitMind on the web and visit the official website. You can also download the desktop version. Quickly register using your valid account for first time users. Click the “New” button to head on its editing interface.
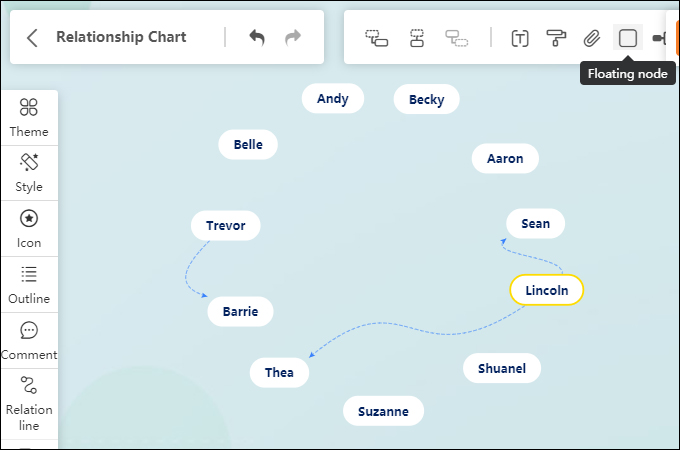
- Start creating a relationship map by dragging floating nodes. Select the square icon at the top menu and click anywhere on the canvas to add nodes. Fill out the nodes with your information and then insert relation line to show the relationship nodes with each other.
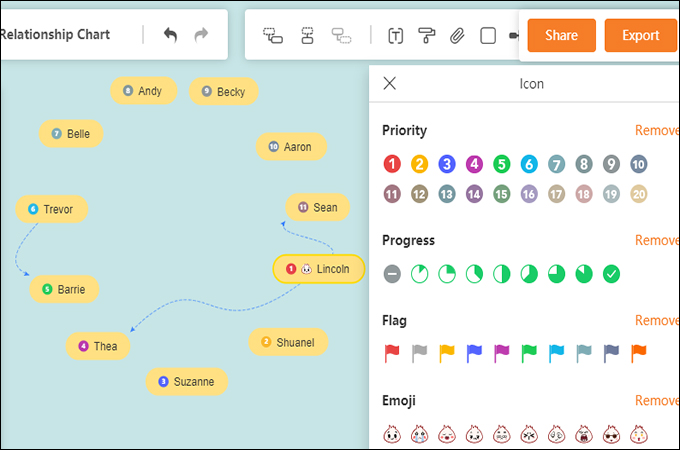
- Now, customize the chart using themes, styles, icons, or insert attachments like images, links, and comments. Finally, click the “Export” button to keep for your records or share the chart via link.
Relationship Chart Examples by GitMind
GitMind comes with a template gallery where you can get started quickly. Pick from and edit pre-designed charts, mind maps, flowcharts, and more. It helps you save time and create an eye-catching relationship diagram. The following are the chart examples by GitMind.
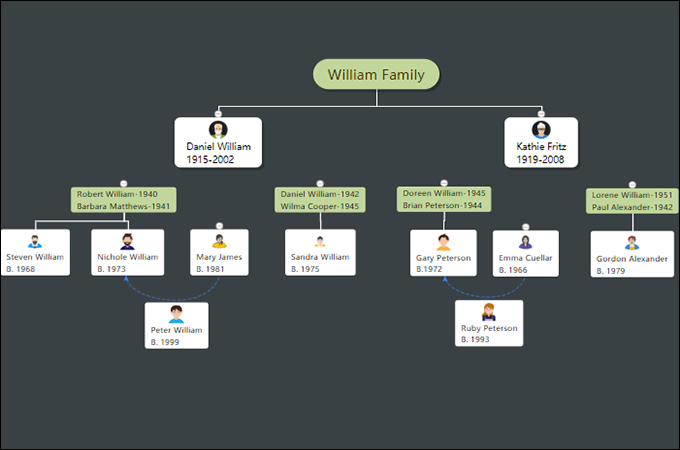
This sample illustrates the family history of the William Family. The main theme comes at the top which is the family and where it all started. Then branching out with grandparents. Children and spouses of grandparents come next. Following after is the second generation which is the grandchildren of the family. Finally, the second grandchildren are at the bottom of the chart.
Another example is the Game of Thrones family chart. You can also use this approach to dissect or analyze characters in specific movies. And the easiest way to do that is to create a visual character relationship chart using this example.
Conclusion
It can be difficult to trace back generations in most societies when there are extended family members. That is why relationship chart models were created. It lets families link family bloodline and learn their family heritage.
Leave a Comment