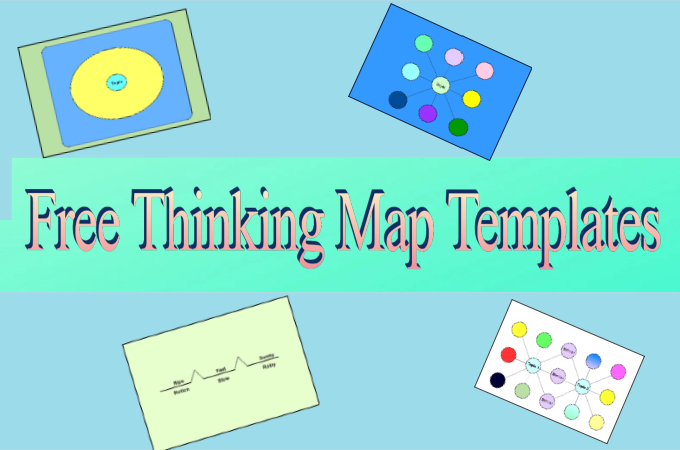
Thinking maps are some of the most common teaching materials used in schools. These maps are used as presentation material for an audience or simply as a chart that contains various information about a topic. There are eight types of these maps, and each are designed for a specific purpose and offers its own benefits. With that being said, if you want to know more about think maps, then you are on the right page. Read on to learn more about these map types and where you can find some of them.
Thinking Map Types
Circle Map
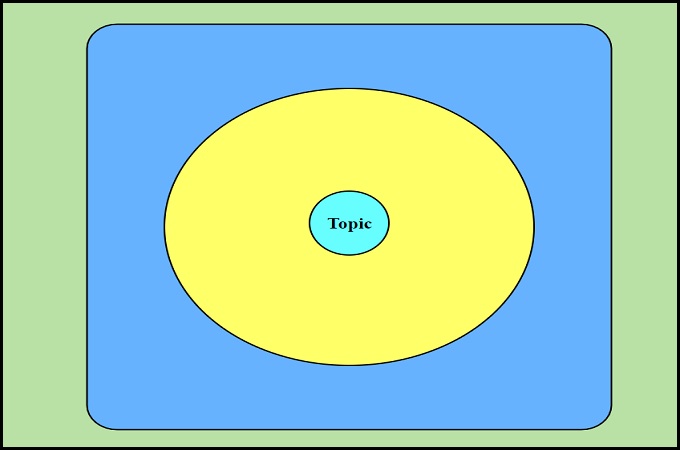
The first type and probably the simplest thinking maps type is the Circle Map. As the name suggests, it is a circle in shape. It is most commonly used for brainstorming sessions as it is perfect for capturing the free flow of information. Aside from that, it is the most straightforward map that you can draw with just a pen and paper. To create one, draw a circle and then write the topic inside it. After that, draw a bigger circle around the first one and then write all available information about the matter inside it. Lastly, draw a square around the larger circle, and write down your sources for the information you shared.
Bubble Map
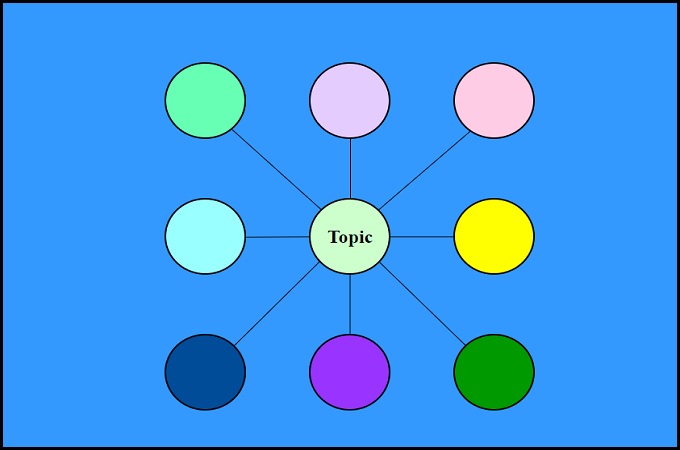
The next type of map that you can use is Bubble Map. This type of diagram is commonly used for analyzing a certain topic using adjectives. In general, it is perfect for character development discussions. The central topic is encircled in a bubble and connected to other bubbles, as many as you like. After that, fill each supporting bubble with adjectives describing the central topic. You can also use this map when introducing a new lesson in class, just like most teachers do.
Flow Map
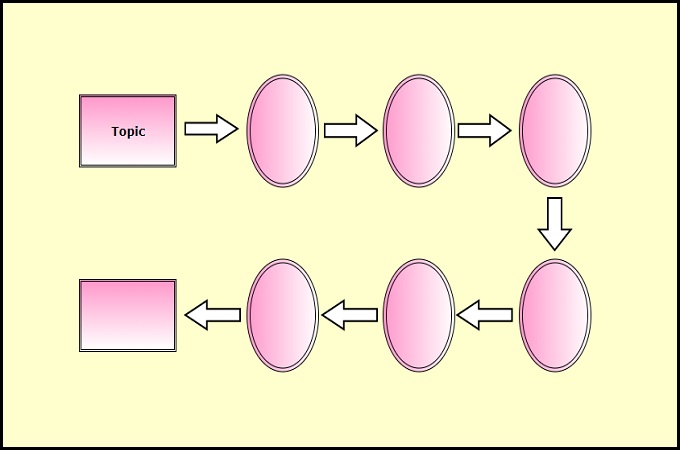
For a chart that shows a sequence or order, take advantage of Flow Maps. This map is probably the most recognizable among other types of thinking maps. This is because it is widely-used when providing step-by-step instructions, which is its primary function. A flow map or flow chart is also one of the most detailed maps that you can use because you can add various other things like images to each column. If you want to create one, start by creating a box and fill it up with the central topic. Then add succeeding boxes and fill them out with information of steps in a logical order.
Brace Map
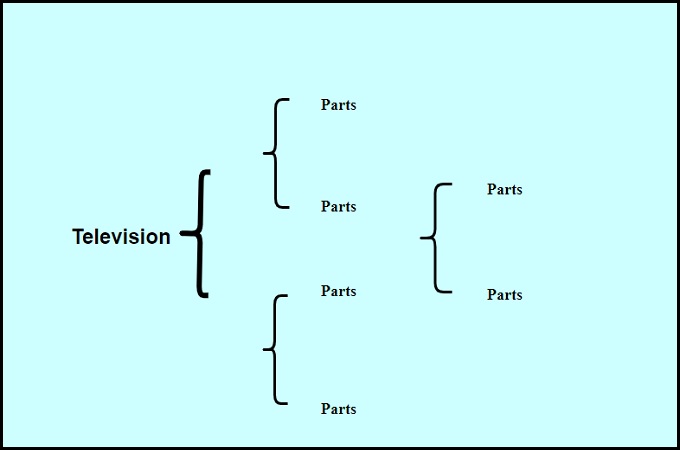
A brace map is often used for showing different components of a physical object. Unlike other thinking maps, a brace map is solely used for breaking down parts and cannot be used for abstract ideas. This map is great for showing and explaining how each component works to make up the central topic. So for example, if you want to break down the components of a Television, start with it as the primary topic. After that, use braces to identify each part of the entire Television device.
Tree Map
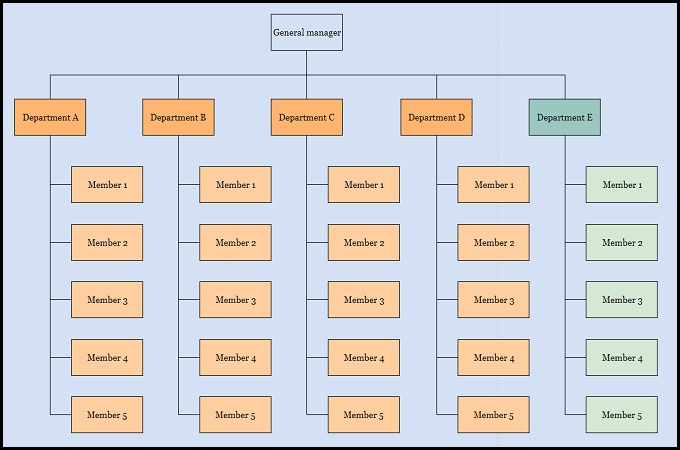
The tree map is frequently seen on bulletin boards and other public notice boards. The most recognizable feature of this map is its well-structured form. This map prioritizes the most important information at the top and trickles down to less necessary details as it flows downward. It is perfect for showing a company or organizational hierarchy or sorting out information according to their categories. Overall, it is one of the most useful thinking maps that you can easily create.
Double Bubble Map
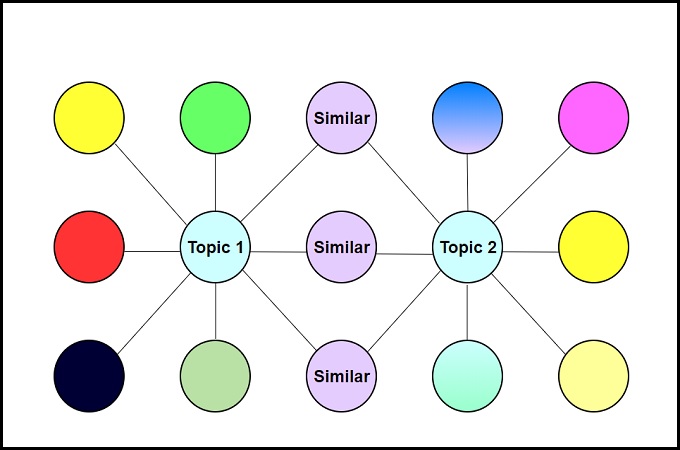
The name of the double bubble map is self-explanatory. The principle is the same as with the previous bubble diagram. You create two separate bubble maps with different topics and find the similarities between the two topics using overlapping bubbles. Upon a closer look, a double bubble map resembles a Venn diagram, only more organized and easier to understand.
Multi-Flow Map
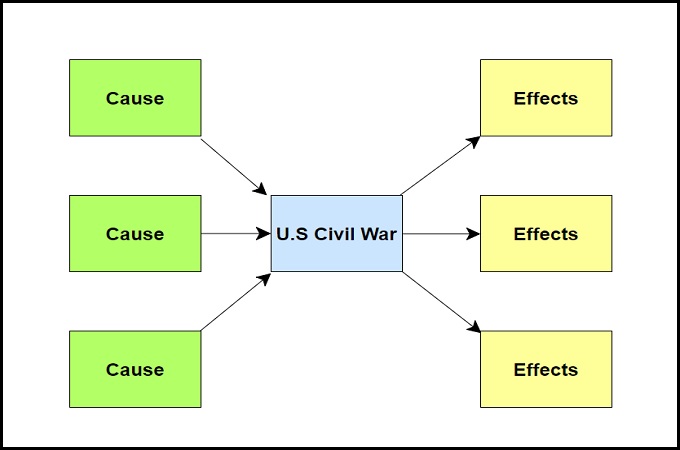
Multi-flow maps are commonly used to show causal relationships of events and such. This map is simple and easy to understand, making it perfect for school presentations and public forums. Apart from that, this map is versatile enough that you can use it to show only the cause without the effect and vice-versa. However, the whole point of using a multi-flow map is to show the relationship between the central topic and the cause or effect and not the other way around.
Bridge Map
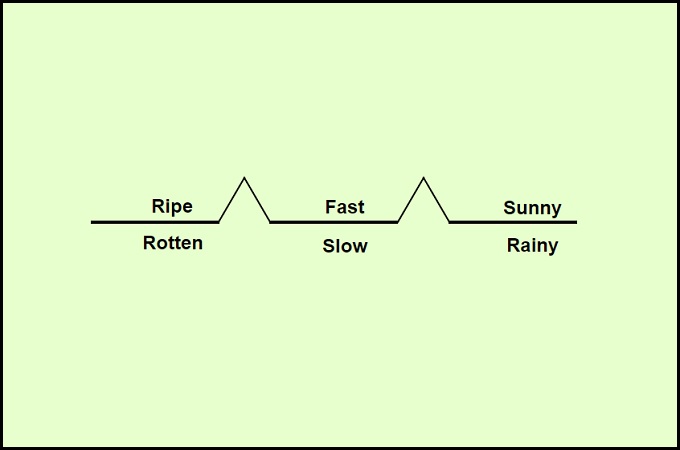
Finally, we have the Bridge Map. Similar to the double bubble map, a bridge map shows the relationship between two or more topics. The similarity ends there because the purpose of this map is to make analogies between different ideas. The map is also not easily readable if you are a beginner because every part corresponds to a different meaning. On the other hand, once you get used to this map, it’ll be easier for you to determine analogies and get the main idea of every bridge map you encounter. Aside from that, you can use this thinking map to create fill-in-the-blank exercises for students.
Conclusion
Using a thinking map is not a new concept for educators and students. However, knowing which map to use at a certain point in time is crucial for a successful lesson. That is why we provided you with all the different forms of thinking maps, and the proper way to use them. This will guide you later on whenever you need to use a map.
Leave a Comment