
Data measurement and storage are more important than ever in today’s environment. Organizations rely heavily on data analysis and recording to find errors, points of involvement, and ways of improving their procedures, manufacturing, and deliveries. The following comprehensive method will provide an in-depth comprehension of the strip chart as well as how they diverge, and which framework is ultimately more effective, cost-effective and precise. Meanwhile, if you want to try this great technique, you can continue reading below.
Introduction to Strip Chart
- Definition of Strip Chart
- Basic Components of Strip Chart
- Benefits of Using Strip Chart
- Strip Chart Examples by GitMind
Definition of Strip Chart
A strip chart is a form of charting in which the quantitative method is shown along with a single sheet. Strip charts, like charts, may help you visualize collected data. Strip charts are an excellent alternative to graphs when the sample size is very small enough to display individual data points. A chart recorder is a device that may record mechanical or electronic trends onto a roll of paper. Chart recorders can record many inputs at the same time using different colored markers that really can work on strip graphs or circle charts at the same time.
Basic Component of Strip Chart
A strip chart is designed with several components: axis, crosshairs, elements, grid, legend, marker, pen, and postscript.
Axis – A strip graph can actually show up to four coordinate axes and each of them consists of an axis line, title, ticks, and labels.
Crosshairs – Crosshair is used to position the pointer in the connection to the coordinate axes. Perpendicular lines are drawn between the graphing area.
Elements – An element is a collection of data points. The presentation of the component, such as its symbol, layer thickness, and color, is changeable based on strip plot definitions.
Grid – Extends the large and small ticks of the X-axis and/or Y-axis across the determining the area
Legend – Each data entity’s name and symbols are displayed in the legend. The legend can be placed anywhere in the margins or in the charting zone.
Marker – This component is used to annotate, mark, and highlight specific areas within the strip chart.
Pen – Pens are used to describe how data components should be rendered. A data element may employ many pens at the same time.
Postscript – The component is capable of producing enclosed script output. This module provides several possibilities for configuring how the output is produced.
Strip Chart Examples by GitMind
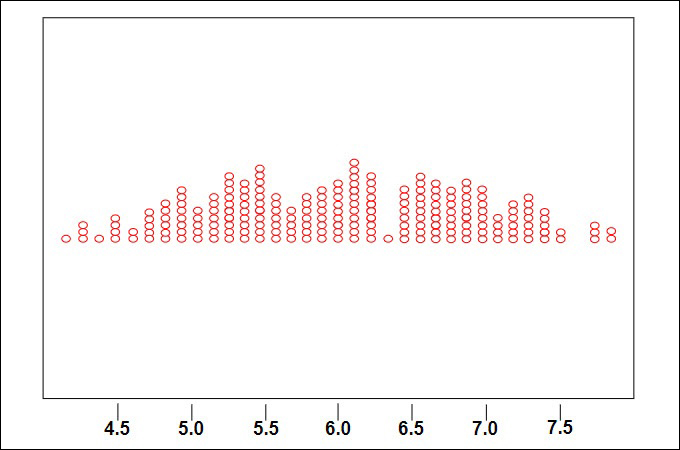
A strip chart is an excellent choice for displaying a basic plot of a few data points. This fundamental concept will allow us to see where the data lines are along the lines. Although a basic simple plot where the data of the graphs are not relevant, using a one-dimensional scatter plot for a great way to study a distribution function chart, it would be very hard to match a probability with little data. Meanwhile, if you really want to try this great method, you can use GitMind. To learn more about it, click the “Edit this Example” button below, or you can start from scratch if you prefer.
Benefits of Using Strip Chart
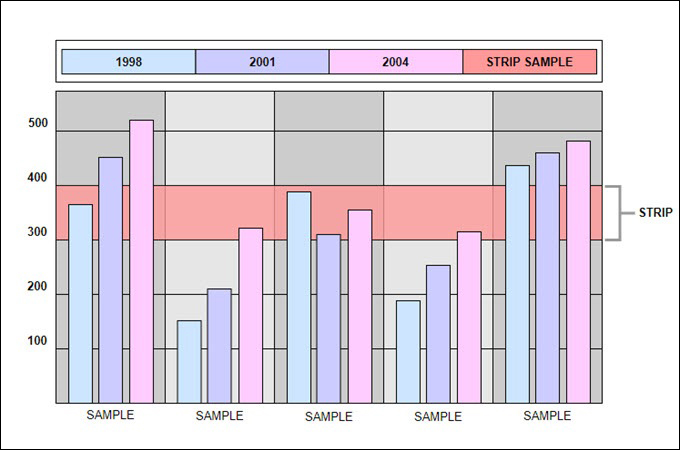
When looking at a limited handful based on discrete data, a strip plot comes in handy. It displays all of the data, and because there are not too many points clogging the plot, it’s instructive. In the case of a tiny dataset, scatter plots and graphical representations are less informative. It also features a combination of elements that are difficult to randomize and those that are simple to randomize. The aspects that are difficult to modify are applied first, then by the factors that are simpler to change. The term split-plot is derived from the parcel of land in farming. Fisher invented it, and it has been proposed that almost all agrarian experiments use split-plot designs. These designs have been commonly seen in the sector, but they can also be included in a wide range of disciplines, which include healthcare.
Conclusion
When looking at a limited amount of one-dimensional data, a strip chart comes in helpful. It displays all of the data, and because there aren’t too many points clogging the plot, it’s instructive. In the case of a tiny dataset, histograms and box strip plots are less informative. As a result, when first charting a tiny data set, we recommend using a strip graph.
Leave a Comment