
Bar chart is an infographics that shows comparison of data using rectangular bars. In fact, there are several types of bar charts or graphs but has the same objective of showing changes over time and easily visualize trends. More importantly, this is a lot helpful when you need to represent a large amount of data in a more comprehensive way. That being said, we prepared the best bar graph generators that will allow you to illustrate bar chart in such a way that is easy to understood while making it appealing to look at.
Best Free Bar Graph Makers in 2021
GitMind
Price: Free
- Simple and easy interface
- Extensive chart shapes library
- Unlimited storage space
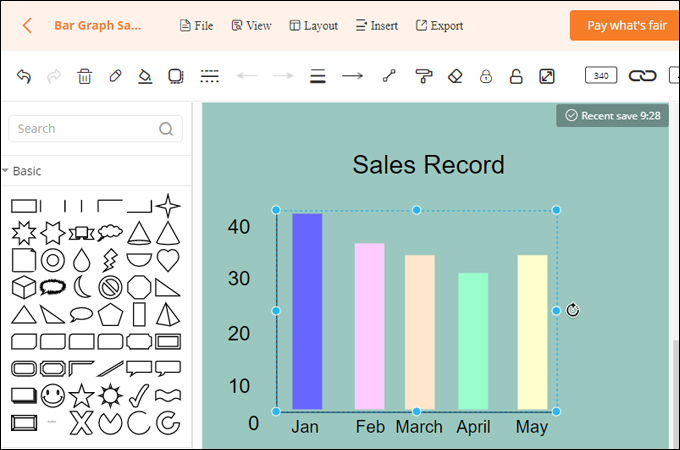
GitMind is an online chart making tool that allows you to represent information in a visual manner. It comes with an intuitive interface that lets you navigate the tool while creating charts online with ease. Whether you prefer to create a horizontal or vertical bar chart, this online bar graph maker will help you create one with the option for editing properties of the elements. You can change the color of the background, choose from the available font style, change the color of the bars, and so much more.
DOWNLOADCanva
Price: Free; $9.99 per month
- Visually appealing templates
- Great customization options

Canva provides a wide range of infographic pre-designed templates as per your needs. Using this free bar graph maker, you can draw bar graphs and other visual representations without much need for customization. You will be amazed by how the objects and blending of colors are put together in a presentable manner. All you got to do is to add your information, make some minimal modifications, and it should be good to go.
EdrawMax
Price: Free; $7.95 per month
- Transform charts into presentation
- Drag-and-drop interface

Another good bar chart maker you should consider using is EdrawMax. Apart from creating charts, you can also make a timeline, brochure, network, network plan with lots of visualization to choose from. What’s more, you can import spreadsheets from Google docs or from Excel directly. Overall, it’s a great choice for making charts offering additional helpful features for a maximum user experience.
Visme
Price: Free; $15 per month
- Download charts as PDF or JPG
- Large storage space

Design a professional bar chart using one of the most recommended bar graph generators no less than Visme. This tool storehouses a huge number of visualization and representation templates to choose from. It does not only allow you to customize charts, an option for editing pictures is also included. Moreover, to keep your charts secured, you can download the projects you made from Visme.
ChartGo
Price: Free
- Import Excel or CSV files
- Automatically generates charts

Bring data to life by creating rich and color charts using ChartGo. This online bar graph generator lets you create several charts including pie charts, line charts, and area charts. With it, you can instantly create charts by just configuring the settings in terms of height, width, and even display legends, show values, and a lot more. The only downside though is that you cannot freely arrange the objects according to your desired output.
Smartdraw
Price: Free; $9.95 per month
- Save charts and project on cloud
- Extensive collection of templates and symbols

Smartdraw is yet another bar chart maker that offers a variety of examples covering different requirements and needs like engineering, networking, floor plan, mind map and so much more. Additionally, the tool features a smart panel by which dedicated tools are accessible for further modification and enhancement. Moreover, it comes with an online and desktop application allowing you to work no matter you are offline or online.
Infogram
Price: Free; $19 per month
- Interactive types of charts
- Offers animation for objects

Create a visually appealing and engaging bar chart with the help of the Infogram. This is also an online bar graph maker that lets you quickly create charts from ready-made templates. When editing the colors, adding values, you can change immediately reflects on the actual illustration. You can also add a geographical map in the same canvas where you are editing.
Gliffy
Price: Free; $7.99 per month
- Responsive interface for easy diagramming
- Track and retrieve changes in diagrams

This list will not be complete without Gliffy. This platform also proves to be flexible from chart creation, real-time collaboration and exporting and exporting projects. The best part is, this free bar graph maker lets you retrieve previous changes with your chart at any moment. This helps you keep track of the changes and look back on them if needed.
Conclusion
If you want to show changes or visualize trends, bar charts are just created for this purpose. Though it’s possible to do it by hand, bar chart makers as the above will make it easier especially when you need to retrieve a huge number of data. Find out which one that best fits you or suggests one that you have tried and share it in the comment section.
Leave a Comment