
Bar graphs are one of the most commonly used graph in various field. Probably one of the most simple one to make, bar graph or sometimes called bar chart comes in two way, either horizontal or vertical. The chart provides numerical data by plotting columns in the corresponding values. These are used for presentations, statistical reports and more. On that note, quantitative research gets huge benefits from this type of chart. To give a clearer picture of what it looks like, we will provide you with some bar graph examples below. Check out these template, and feel free to use them if you like.
Bar Graph Examples and Templates
- Mobile Market Worldwide Share Bar Graph Example
- World Fast Food Data Bar Graph Example
- User Acquisition Bar Graph Example
- Quarterly Sales Report Bar Graph Example
- Unemployment Rate Statistics Bar Graph Example
Mobile Market Worldwide Share Bar Graph Example

First template on that we have is about the mobile competition around the world. The data shows competitors in the said industry, with their sales on each month respectively. The data was gathered in the year 2020 and was detailed to provide concrete idea about the most dominant mobile phone brand. The data ran from 2017 until June of 2020 which is a total of 3 and a half years. This bar chart example is available for download and can be used by clicking the button above.
World Fast Food Data Bar Graph Example
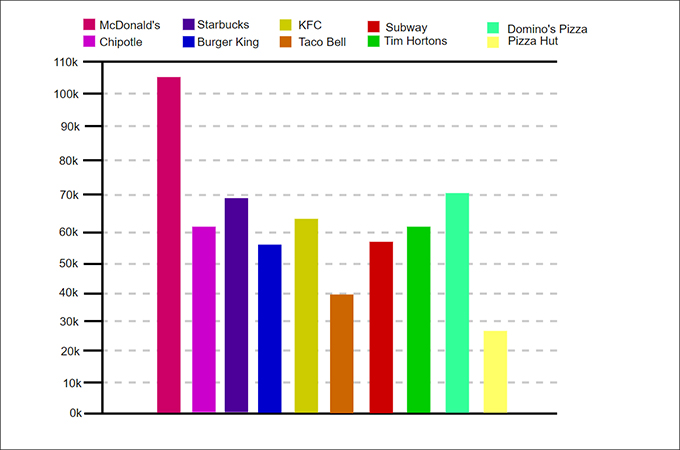
This template presents the total data of every major fast food chain in the US and their value. It compared the data of 10 popular fast food chains, and their performance in the year 2020 where most establishments closed due to the pandemic. Among the participants are KFC, Chipotle, and Taco Bell which are all popular not only in the US but abroad as well. This bar diagram example is also available to download for free.
User Acquisition Bar Graph Example

In marketing, it is important to keep track of user acquisition. This is the process of acquiring new users especially in mobile applications through marketing strategies. As the sample shows above, there are numerical equivalents to the number of new user that a mobile application acquired in a certain period. On top of that, they are categorized by their nature of transfer. For example, if a friend referred the app to another friend, then that falls under the referral section and so on. In order to completely understand this piece of sample bar graph, you’ll also have to have basic knowledge in marketing strategies. Overall, it doesn’t change the fact that you can use this template for free.
Quarterly Sales Report Bar Graph Example
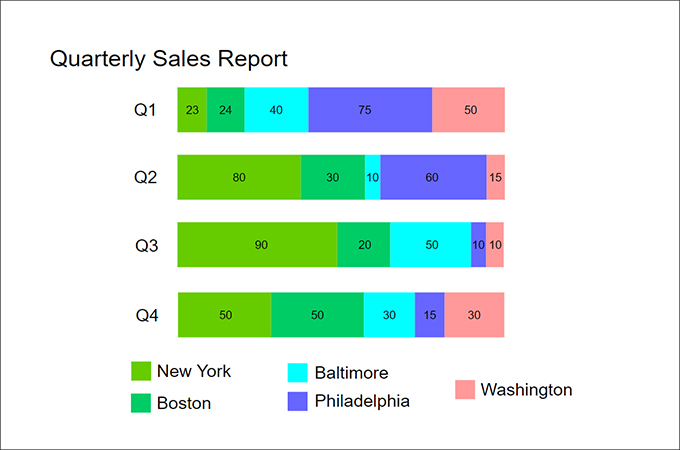
Every company rely on reports to track their performance for a specific year. The same goes for any organization affiliated with sales business. As seen on the template, sales within a year are presented per quarter. The data are color tagged to represent a location where the sales happened. This is essential to determine which locations perform better and where it needs to boost their sales. You can click the button above to edit and download the bar graph example.
Unemployment Rate Statistics Bar Graph Example
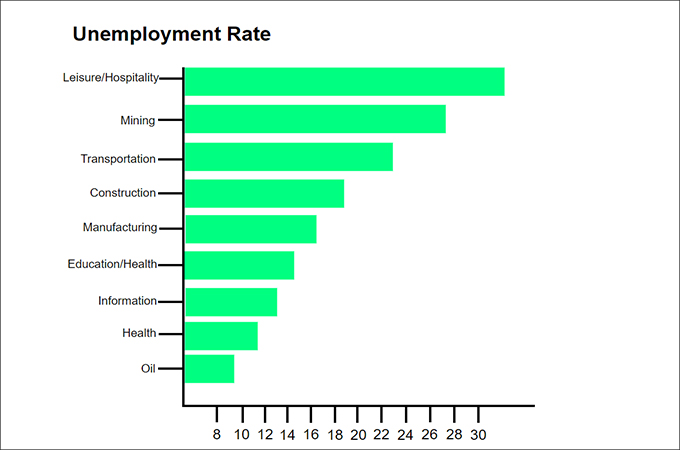
The last template features the unemployment rate data as of July 2, 2020. As seen on the chart, the industry with the highest unemployed employees is the Leisure and hospitality. This is a clear result of the recent pandemic that halted all leisure activities with the lockdowns. There are also other affected areas like mining, retail and wholesale and Manufacturing. If you feel like using this bar chart example template, click the button above.
Conclusion
There are many ways to use bar charts. As seen from the various templates above, there is no question that it is indeed one of the most versatile chart out there. However, accuracy still is a top priority which is why it is recommended to use tools that can provide ready made templates. This way, you’ll only have to input the data you need to present, instead of spending time making one. The bar diagram example above are great examples of these templates since all you need to do is click a single button and your template will be ready.
Leave a Comment