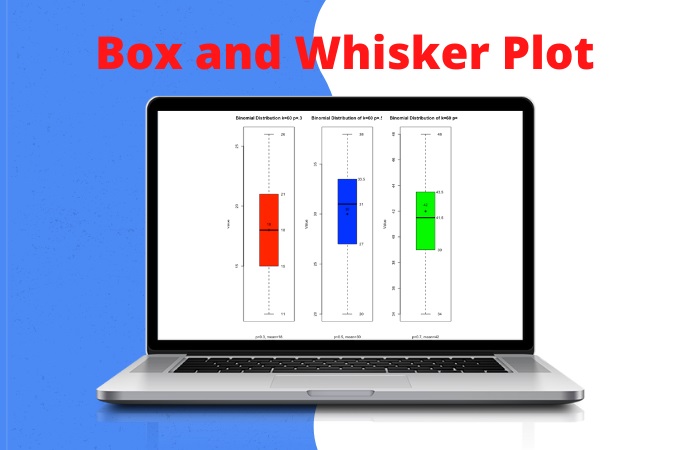
A box and whisker plot is a diagram primarily used in statistics that shows data in quartiles. It got its name from the box and lines which are called whiskers that represents variable data outside the quartile. At first, it may sound complicated to understand this plot, but with the right information, you’ll see that it is fairly easy to read. With that in mind, we created this blog to give you the general idea of what a boxplot is all about. Continue reading below to learn more information about it and also see some templates that you can download.
Box and Whisker Plot
- Box and Whisker Plot History and Definition
- Benefits of Using Box Plot
- Box and Whiskers Example by GitMind
Box and Whisker Plot History and Definition
The Box plot was first introduced in the 1970s by John Wilder Turkey. It was then later published in his book titled “Exploratory Data Analysis” in 1977. As mentioned this diagram is used for visualizing statistical data in an easy to read manner. To be precise, it is used to show the range, distribution symmetry and central tendency to show the variability and of values in a distribution.
Benefits of Using Box Plot
One of the reasons why the box whisker plot has continued to be used over the years is due to its many benefits. Aside from the fact that it is one of the easiest to understand, it can also be used to show the outliers in a data set. With that being said, we listed down some of the other benefits that you can get by using the box plot.
- Can summarize large data with minimal effort
- Can hold multiple distributions at once
- Provides indicators about the symmetry and skewness of the data
- Save a lot of space when presenting various statistical data.
Box and Whiskers Example by GitMind
Templates are really common these days as they provide a lot of convenience. Of course, you will find a lot of Box and whisker plot templates on the internet since it is widely used. On the other hand, it is also possible to make your own box whisker diagram using tools available online, like GitMind. However, we strongly recommend using premade templates because of the amount of time that you can save. With that being said, we prepared some templates that you can download and edit for free.
- Box Whisker Plot Template
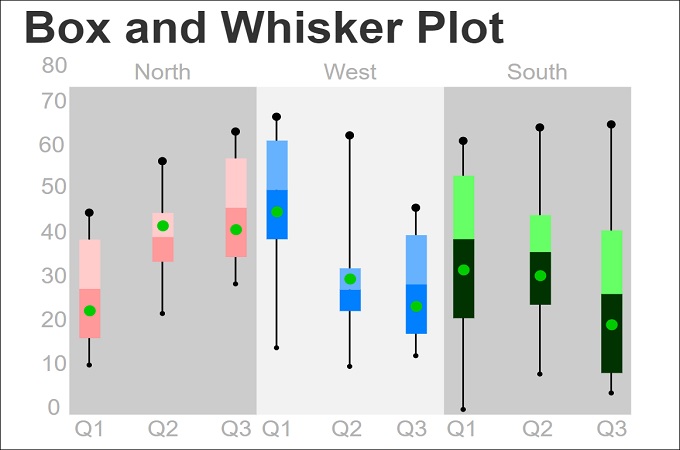
This box plot template contains data from 3 locations namely the North, West and South. You can use this template as it is if you want. It is also editable if you have additional data that you want to add. If you want to download this template, simply click the button above.
- Box Plot Template

The template above show various industries and their respective performance. As seen from the diagram, they are color coded to show distinction. Same with the previous one, you can also download and edit this box whisker plot template for free.
- Blank Box Whisker Template

Last template that we have is a blank one, which can be used for any occasion. The template is also customizable which means that you can change the appearance, like colors and text fonts. Aside from that, you can also share this box and whisker plot template to your friends via URL and work together to complete it.
Conclusion
Statisticians do have a lot of tools that they can use, and one of them is the Blank and Whisker Plot. If you are looking to present various variables then this is the one that you should use. Aside from that, you can easily find templates of this plot on the internet which is a great convenience. That is why the next time that you need a diagram that can hold multiple data at once, you know which one to use.
Leave a Comment