
Mathematics is a very complex subject. It is critical in any scientific experiment, as is computing probabilities. When computing probability, scientists and mathematicians use a probability tree diagram to simplify things. However, this type of chart is not only limited to scientific purposes, as there are certainly other uses too. If you want to fully understand what this method is and how you can apply it to your daily activities, continue reading below.
DOWNLOAD Probability Tree Diagram Definition and Practical Uses- What is a Probability Tree Diagram?
- Probability Tree Diagram Example
- Practical and Real Life Uses of Probability Diagram
What is a Probability Tree Diagram?
Probability diagrams are very intimidating when you look at them for the first time. However, we hope to make them more straightforward in this diagram. To put it simply, a probability diagram or math tree diagram shows the possible outcomes of a situation. Most of the time, it is used by scientists to calculate the success rate of their experiments. In general, this type of diagram is a way to visualize data in an orderly manner to aid in solving mathematical and scientific problems.
Sample Probability Tree Diagram from GitMind
The probability tree diagram comes in all forms and designs. Though it may look complicated and confusing at first, there are some tools that you can use to make it easier. With that being said, there are tutorials that teach you how to make tree charts that you can watch or read online. To give you a further idea of what this type of map really looks like, here are some samples that we created using GitMind.
Probability ProblemAs a Football player, your favorite position is being the Goalkeeper. However, you are not sure if you’ll be the Goalie because it depends on who is coaching your team for the day.
- During Coach Ronnie’s turn, the chances of becoming the Goalkeeper of the team is 60%
- However, with Coach Luke, your chances of being the Goalkeeper is only 40%
Out of 10 games, 6 of them were coached by Ronnie, giving you a probability of 0.6. To compute the probability of you becoming the Goalie for the day using a probability tree diagram, follow the steps below.

- First, enter the names of the two coaches of your team. Next, enter the data that you gathered; in this case, it’s the times that they coached within ten previous games.
- Next, enter the probability for each coach that you will become the Goalie. For Ronnie, its a 50% chance that you’ll make it so it will be 0.5. Calculate the same for the other coach.
- Once all data are provided, multiply the number of games that each has coached for the past ten games with the number that you got after computing the chances to become the Goalie. Once you got the answer, add both of them together, and the sum of it is the probability of you becoming the Goalkeeper of the day.
- The last step is to check if your computation is correct. All you need to do is to compute for the remaining probabilities, and then add them all together. You need to get one (or 100%) as the sum, and if not, then check your computation and do it again if necessary.
Practical and Real Life Uses of Probability Diagram
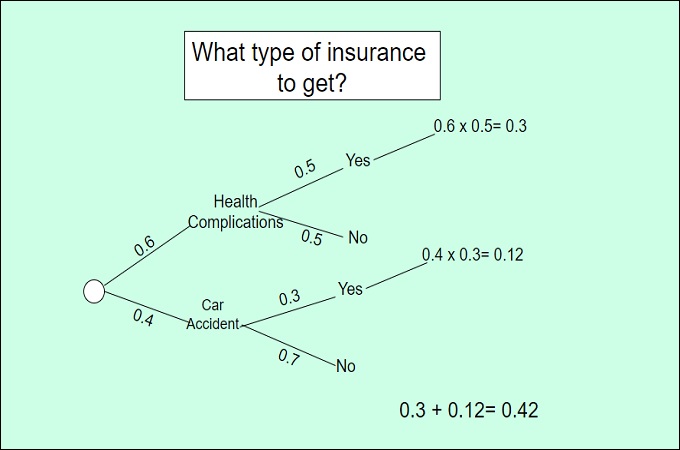
Insurance – When choosing the right insurance policy for you or your family, you can use probability diagrams to decide which plan suits you best. As we all know, there are many insurance policies, and they all differ in coverage. Using a probability diagram to identify the most common factors that you will probably face in the future can help you decide which policy you’ll benefit from. For example, if you are a chain smoker then it is a given that you need health insurance since the risk of health complications is higher compared to getting in a car accident when you don’t even drive that much.
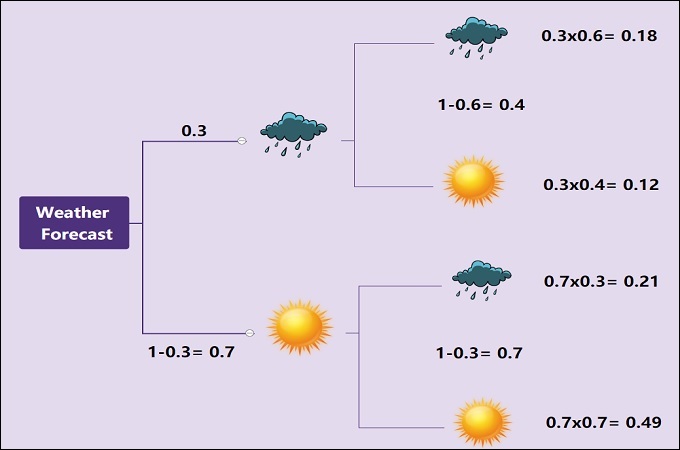
Weather Forecast – Another real-life application of the conditional probability tree diagram is in weather forecasting. Meteorologists predict the weather based on the data that they’ve gathered in the past few days. This is one of the most critical, yet unnoticed applications of probability diagram.
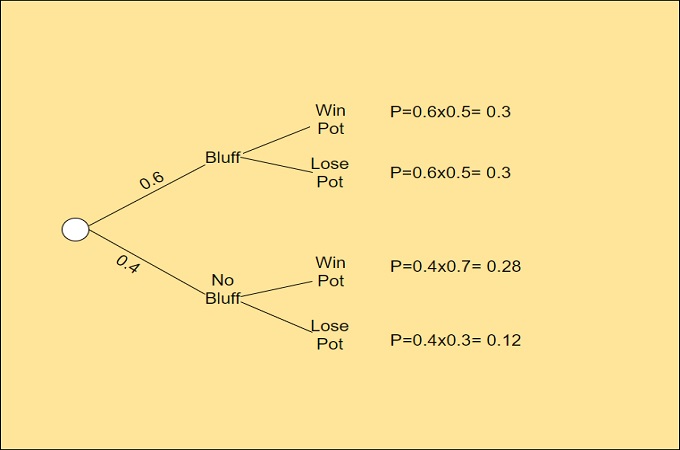
Games and Recreational Activities – Professional board and card game players can also use a probability diagram to calculate the outcome of their games. In professional poker, one can calculate the odds that they will get the card that they need to win the round. Knowing such odds can determine the outcome of the game in advance.
Conclusion
Math tree diagrams are one of the most complicated and intimidating types of charts. That is why most people do not use them. However, if you read the detailed post above, you will learn that it is not as hard as it looks.
Leave a Comment