A bubble chart is a type of diagram that details three-dimensional data. Highly similar to a scatter plot, it also utilizes disks or circles to represent data. Each disk placed on the diagram represents three variables, which are labeled as V1,,V2, V3. This chart is frequently used to show relationships in various fields like social, economical and medical fields. Despite looking simple and plain, this chart is one of the most confusing to read. This is because there are times when a data will overlap with another, which can mislead readers. However, with proper understanding, you will get the hang of it.
Ultimate Bubble Chart Tutorial
Bubble Chart Best Practices
As mentioned, a Bubble diagram can be easily misread and cause confusion. That is why it is important to adapt the best practices when making one. With that being said, we listed some of the best practices that you can practice. This way, you’ll be able to make quality charts every time.
- Scale disks according to value
One common mistake committed when making this type of diagram is the size of the disk for the variables. This error not only consume too much space on your diagram, but also misleads the readers into thinking that is the real value of the variable. On that note, always be mindful of the diameter of the disks that you input on your bubble graph.
- Place a legend section
One way to avoid confusing the readers is by letting them know what they are reading. Since variables are represented by the bubbles, then it will be natural to place a legend section. This is useful in showing the exact content of the bubble in the chart.
- Clearly show the trend for each chart
When presenting data to an audience, it is important to show the significant trends. What is important in a bubble plot are the two variables that ends up in the x and y axes.
Benefits of Using Bubble Chart
Without a doubt, bubble charts are one of the most complex yet useful charts out there. Aside from the fact that it can present 3D data, there are still many advantages in using it. On that note, we listed down some of the advantages that you can get by using this type of chart.
- Present relationship between three variables and show the changes in the trends
- Show data in 3-dimension to widen the scope of the analysis
- Provides a quick gist of the entire bubble chart contents making it easier to read.
- Represent a fourth variable by adding colors to the bubbles
Free Online Bubble Chart Templates
Using a template these days has become a trend since you won’t have to spend time in making something from scratch. Same can be said with charts and diagram, as they are really time consuming to make. On that note, we created some bubble diagram templates that can be downloaded for free using GitMind. These are also customizable for convenience and can be saved in various formats.
1. Public Policy Coverage Bubble Chart Template
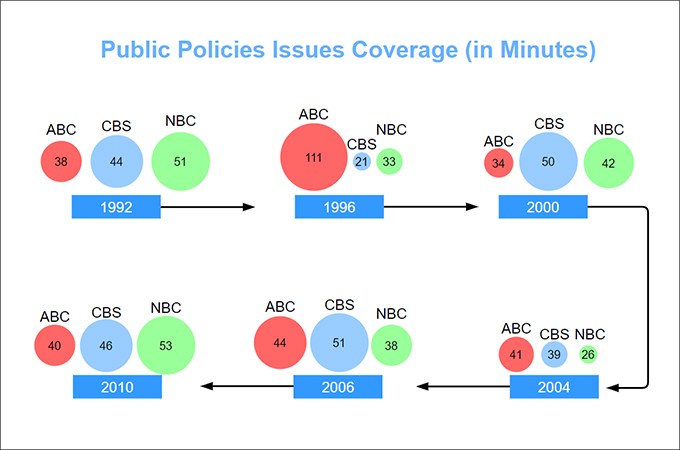
Public policies are one of the most sensitive topics in any nation. That is why covering them pose certain risk and can cause mass confusion. However, it is still a part of basic human rights to know what’s going on about these policies. The template above shows an example of US broadcasting networks and the data of their public policy coverage from various years. You can download this bubble graph template by clicking the button above.
2. Fashion Website Most Searched Keywords Bubble Chart Template

This template features the most searched keywords from a fashion website. These keywords determine the products that are most in-demand among buyers. Using these data, fashion websites can focus their inventory towards these products and so that their stocks won’t easily get depleted. Click the button above to edit this bubble plot if you have more information that are not part of the variables.
3. Quarterly Risk Assessment Bubble Chart Template
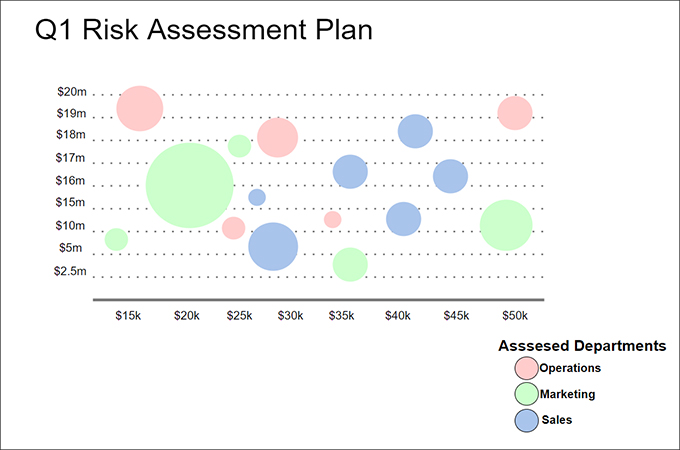
Last template that we have is a blank quarterly risk assessment template that can be used by anyone. This is a useful tool for company presentations and similar functions with an audience. The template shows the gains and losses from 4 months of operation which is ideal for auditing the quarterly growth of an organization. To edit the bubble chart template, simply click the button above.
Conclusion
Bubble charts are without a doubt one of the most useful when it comes to presenting complex variables. Additionally, once you get the hang of it, you’ll be able to navigate your way through various data and their corresponding variable. If there are things that you still don’t quite understand about bubble diagram then we suggest to read the first part again.
Leave a Comment