
By being aware of the demand and supply graph, you can determine the opportunities, risks, and challenges of your business. You can also develop strategies that will help you boost demand and increase your profits at the same time. Today, learn how to make a diagram of how you can manage the demands and supplies in your business. Furthermore, gain more knowledge about demand and supply with the macroeconomic laws provided.
What are the Demand and Supply Curves?
In order to fully understand the demand supply graph, you need to learn what each demand and supply curve means. In economics, a demand curve is a graphic representation of the relationship between a product’s price and the amount that is demanded. It presents the quantity of a specific commodity or services consumers will be purchasing at a given time frame. Moreover, the graph is built with the quantity demanded on the horizontal(X) axis and the price on the vertical(Y) axis.
Meanwhile, the supply curve indicates the volume of goods that merchants will sell at each price during that time. It presents how the change in the price of the products or services affects the amount of seller will produce. Anyway, the graph’s vertical axis represents product pricing, while its horizontal axis represents the amount of the product offered.
The Law of Demand
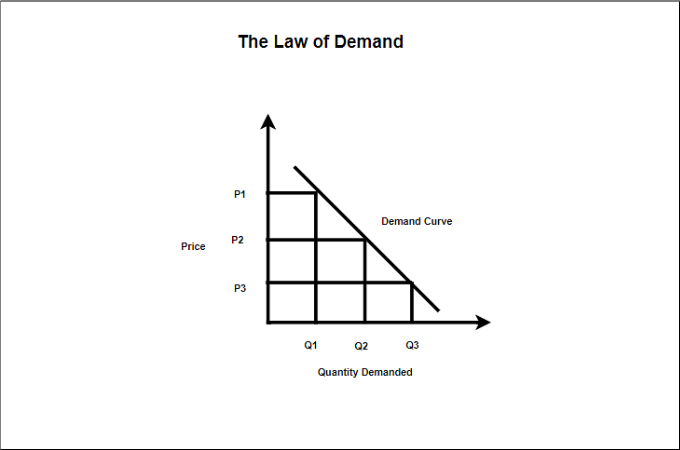
According to the law of demand, the quantity bought varies inversely with the price. It means that the quantity demanded decreases as the price increases. This happens when the marginal utility is reduced as consumers utilize the initial units of an economic good. With that, they buy to fulfill their fundamental needs first. And then they use each additional unit to fulfill progressively lower-valued scarcities. It explains how market economies distribute resources and set the prices of goods and services that we see in daily transactions by combining the law of supply. See the graph above to understand the rise and fall in demand. Briefly, it can help you understand the supply and demand diagram that will be discussed later.
The Law of Supply
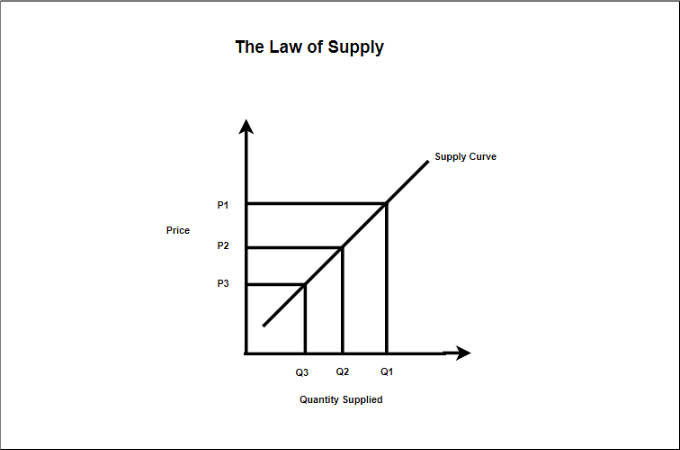
Supply is the total quantity of a particular commodity or service that is offered to customers at specific pricing. A product’s price is directly influenced by changes in supply and demand, which occur as a result of supply fluctuations. Thus, the law of supply states that when the price decreases, the supply of an item rises. However, if the demand is high and the supply is low, there is the possibility of a price increase. See this aggregate demand and supply graph to visualize the law of supply carefully.
Market Equilibrium
Economists discovered that price changes are typically found to be close to the equilibrium levels. When market supply and demand are in balance, prices become steady in equilibrium. In general, a surplus of goods or services leads to lower prices, which increases demand, whereas a shortfall or undersupply raises prices, which decreases demand. Over time, these actions maintain a relative balance at the equilibrium level.
How to Create a Demand and Supply Graph?
- Tabulate the Demand and Supply Data
- Plot the Demand and Supply Axes
- Design Your Template
- Analyze the Data
- Share the Demand and Supply Graph
1. Tabulate the Demand and Supply data
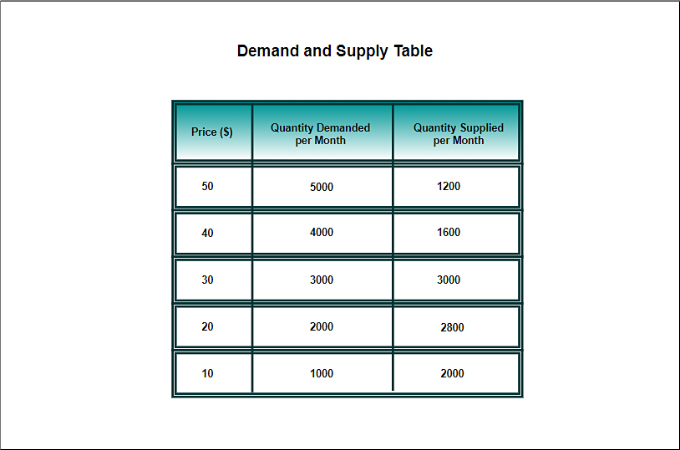
Using a table can help you organize the data you have gathered. It will also help you to determine important details such as the price, the number of supplies, and the amount of demand. Moreover, it will help you to compare the pricing at a given period. Getting accurate research data will help you to oversee the number of products and services more efficiently.
2. Plot the Demand and Supply Axes
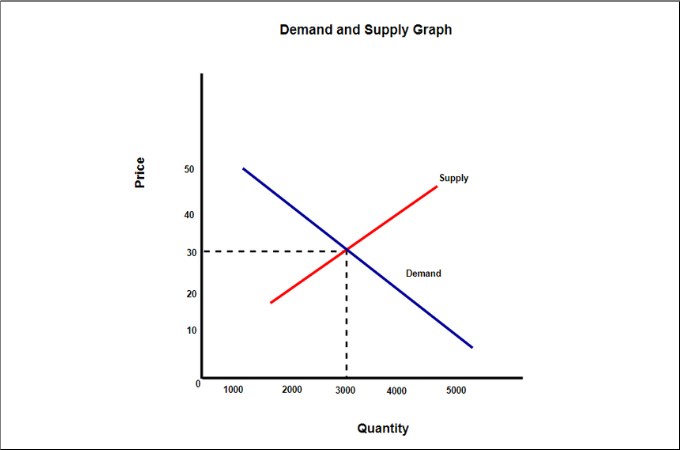
As mentioned earlier, the horizontal or X-axis represents the quantity of demand and the vertical or Y-axis is for pricing. Based on the data gathered, label and place the supply and demand data for its pricing. This will allow you to get the demand and supply curves. Also, you can also see the equilibrium pricing.
3. Design your template
You can add some images and colors to make it more visually appealing. On top of that, it will help you to identify key points in your graph easily. You can insert some icons or designate line colors that will represent specific data from your diagram. Further, you can use the built it template and backgrounds that the tool offered for you.
4. Analyze the Data
Once the graph is all set, you can now analyze the data based on the plotted results. You can now compare In order to analyze your current supply and demand diagram, look at sales data in relation to your inventory. Reduce demand if you are buying more than you are selling to reflect the volume of sales. Increase your orders to sell more products if you are frequently out of stock because this indicates that demand is high.
5. Share the Demand and Supply Graph
In GitMind, you can collaborate or share your templates with your friends, colleagues, or stakeholders. Let them know the results of your graph and let them add comments or suggestions. Anyway, if you want to save the template, you can have them in JPG, PNG, PDF, WORD, or TXT format.
Conclusion
Knowing how to create a demand and supply graph could help you identify how much your consumers might purchase. This could also help you manage the demands and supplies that you need to produce at a given time. In this case, you can handle the services and products that you offered properly while increasing your profit.
Leave a Comment