A fishbone diagram is one of the most basic tools used in qualitative studies. This diagram is also known as a cause and effect diagram because it shows factors that caused an event . Fishbone diagrams are proven effective in identifying the root cause, which you can use to make counter-measures. This applies to various fields like marketing and sales, making it one of the most useful diagrams. If you want to learn how you can get or create your own fishbone diagram template, continue reading below.
Ultimate Fishbone Diagram Tutorial
Free Fishbone Diagram Templates to Download
As mentioned above, fishbone diagrams provide multiple benefits, which makes them very useful in various fields. Aside from providing a visual presentation of the cause and effect between things, you can also use it to show possible solutions to future problems. On that note, here are some fishbone diagram examples that you can use for free.
- Fishbone Diagram Uses in Manufacturing

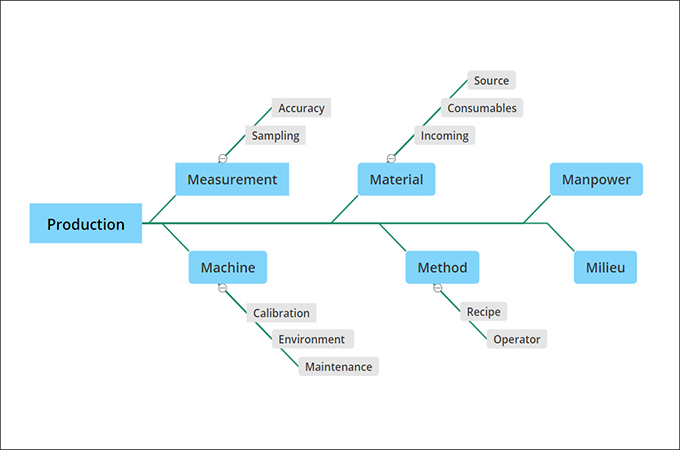
Manufacturing is one of the most complicated industries out there. It involves a lot of processes and materials which makes it prone to a number of issues. That is why fishbone diagrams play a vital role in the planning process in this industry. It helps find common problems and mitigate future problems. With that being said, here is a free fishbone diagram template that you can use in the manufacturing field.
- Fishbone Diagram Uses in Marketing

If there is one thing that is constant in the marketing field, it is uncertainty. There are just so many factors that can come into play at any second. At the same time, it also benefits a lot from using fishbone diagrams as it can predict future problems, and prepare you to face them.
- Fishbone Diagram Uses in Sales

Sales can also benefit from using the fishbone diagram. Using it will show you the relationship between the factors affecting the sales process. Doing so can give you an idea that you can use to boost your sales. Here is a sales fishbone diagram template that you can use.
- Climate Change Fishbone Diagram Template

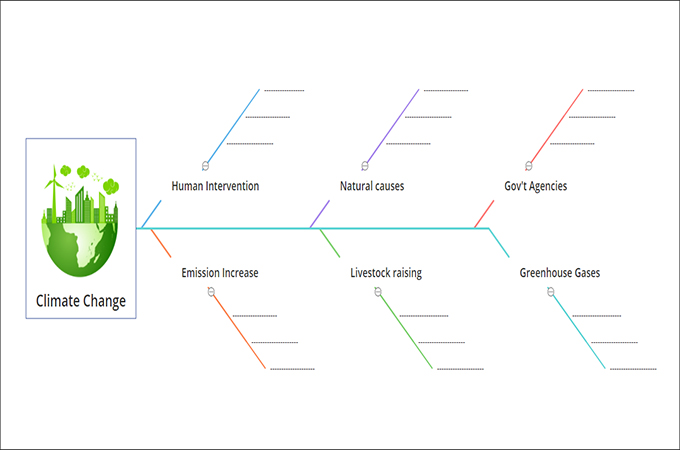
Fishbone diagrams have many applications and there is no doubt about that. As seen from the fishbone or ishikawa diagram template above, there are many factors that contributes to climate change. To get a full grasp of the situation, one must first know the causes and the effects of climate change to the environment. As Newton’s 3rd law of motion states, “Every action has an equal and opposite reaction.” This is true since there are factors in the environment that directly contributes to climate change. If you want to use the cause and effect diagram template above, simply click the button.
How to Make Fishbone Diagram Using GitMind
The above templates are ones that you can use immediately. However, if you want to create your own custom fishbone diagram, then we suggest you use GitMind. This is a free web-based fishbone diagram creator that you can use anytime. It provides various options that you can add to your diagram. Aside from that, it has a lot of ready-made templates that you can use. To learn how to create a free fishbone diagram template using GitMind, follow the steps below.
- Launch GitMind from your web-browser, and then click the “New Flowchart” or “New Mind map” button.

- From the editing panel, you can click the “Layout” button and select the fishbone setting.

- You can now proceed to make your diagram, as it will automatically add the necessary nodes in the form of a fishbone. Once done, you can save your diagram on your local storage by clicking the “Export” button.

Conclusion
A Cause and Effect diagram or Fishbone diagram can definitely benefit you. However, it is also a fact that creating one is time-consuming. On the other hand, there are many ready-to-use templates on the internet to save time. Alternatively, you can make your fishbone diagram template using simple tools like GitMind for a personalized experience.
Leave a Comment