
A histogram is often used in statistics and mathematics to present data frequencies. In general view, it looks like your typical bar graph which makes it fairly easy to make. The appearance is also the same, which adds to the sense of familiarity with bar graph users. However, reading a histogram takes skills as it visualizes complicated and varying data. If you are not careful in making it, you might end up mixing the data and confusing the readers. On the other hand, there is a way to avoid this mistake, and that is by using a histogram maker. With that being said, we reviewed some histogram tools that can be used on either free and subscription basis.
Best 7 Histogram Makers
GitMind

First on the list of histogram makers that we have is GitMind. There are many free tools on the internet that provides quality output, and GitMind is one of them. This application is a good way to make histogram since it provide it’s features for free. You can freely design and add details to your charts by utilizing the different shapes and elements found in its library. Aside from being a histogram creator, you’ll also find templates of different kinds here. These are also free to download in various formats and are editable as well. Another great thing about this tool, is the online collaboration feature which lets you work with others simultaneously.
Canva

Another tool that we have is Canva. This is an online design tool that can be used to create stunning infographics and charts. What sets it apart from other tools, is the wide-range of templates that can be edited and used for free. Aside from that, it is also a good frequency histogram maker because it support the use of complex images. This means that you can design your chart for presentations and public audiences. As mentioned, you can use these templates as your own by customizing it as you desire. Overall, Canva is without a doubt a great entry to this list.
Meta-Chart

Meta-Chart is an online application that specializes in data visualization. You can make line charts, bar graphs, and histograms using this app. As an online histogram maker is free to use, and can help in making basic histograms. Aside from that, you can also design your chart the way you want it to appear. In general, we can conclude that Meta-Chart is indeed a great addition to this list.
MathCracker

MathCracker is a digital tool designed to help user with their mathematical problems and projects. The tool provides a histogram making feature that you can utilize for free. On simpler terms, we can say that this is one of the easiest tools listed on here. This is because it doesn’t require any advanced knowledge prior to using it. As a matter of fact, this histogram maker only need the details and information of the chart. It will then generate the histogram with the details inserted automatically.
Visual Paradigm
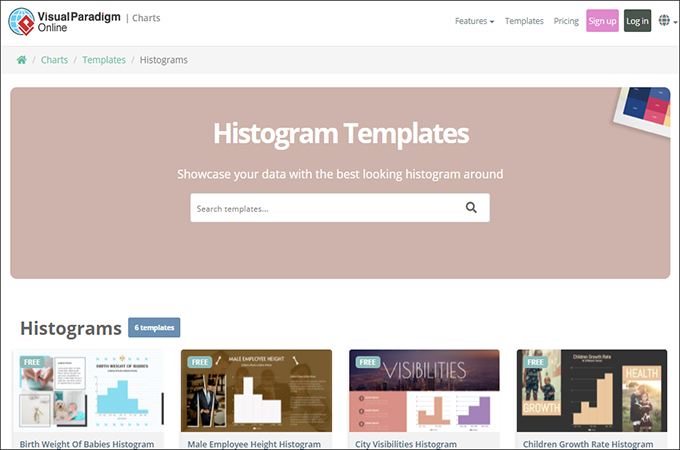
A more popular entry on the list is Visual Paradigm. Most engineers are familiar with it because it has a lot of UML templates. However, that is not the only thing that you’ll find here, as it also have histograms in its library. Additionally, you can also use it as a histogram creator. There are many options that you can include in your histogram such as images, and other clips. That is the reason why we recommend this tool.
Venngage

Venngage is another tool that you should consider using when making charts. This is a similar tool to Canva with many templates in its library. Venngage is free to use if you are after the basic features. However, if you want advanced features then you can opt to subscribe to its premium version. As a frequency histogram maker, there are many options that you can add to make it more appealing the viewers.
Draw.io
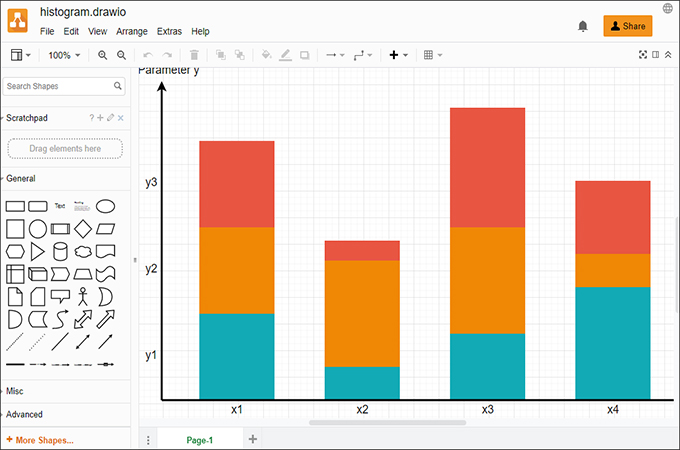
Last tool that we have is Draw.io. This is a free diagram maker that can also be used to make histograms. The tool is very straightforward since it doesn’t provide templates, and only allows chart creation. This online histogram maker is an easy alternative if you are looking for a go-to tool for casual editing.
Conclusion
Histograms are indeed one of the most useful charts that can be used in the field of statistics and mathematics. That is why it is important to keep the information and details as accurate and precise as possible. On that note, you can choose the best histogram maker for you by reading the descriptions above.
Leave a Comment