
Using an Ishikawa diagram will be the best technique to understand and recognize the problem across the whole organization, whether you are a student, marketing analyst, project coordinator, or any other position and working in a firm that belongs to the team that handles projects. This diagram is also one of the greatest graphical ways for understanding and solving problems since it considers all probable causes. Meanwhile, if you want to understand more about this great technique, continue reading below.
Fishbone(Ishikawa) Diagram Introduction
- Ishikawa Diagram Definition
- Components of Ishikawa Fishbone Diagram
- Free Online Ishikawa Diagram Templates
- Benefits of Using Ishikawa Diagram
Ishikawa Diagram Definition
Ishikawa fishbone diagrams are also known as fishbone diagram diagrams, herringbone graphs, cause-and-effect illustrations, and Fishikawa diagrams. They are Kaoru Ishikawa’s causal diagrams, which depict the reasons of a certain action. They are shaped like a fish skeleton, with the ribs symbolizing the causes of events and the end result showing at the skeleton’s head. The Ishikawa diagram’s objective is to help management understand which problems must be handled in order to gain or prevent a certain occurrence.
Based on the Ishikawa diagram template, It is also commonly used as an approach for producing product designs that answer real challenges. It may also be utilized to discover probable elements creating an overall influence on qualitative error prevention. Every reason for this discrepancy is a cause or explanation for inaccuracy. To discover and characterize various variations, factors are often classified into primary groups.
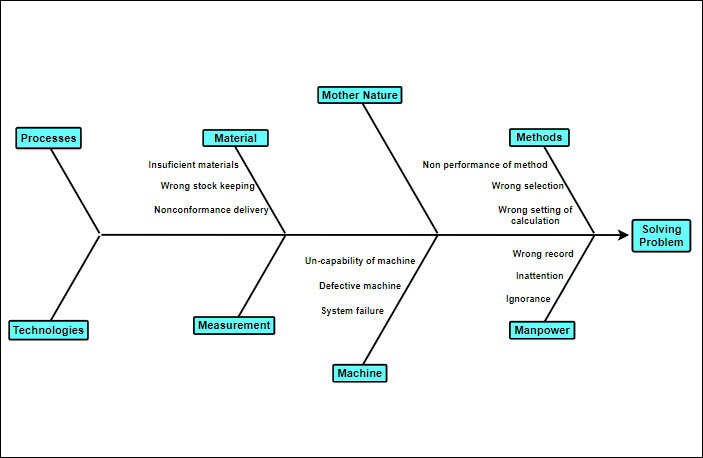
Components of Ishikawa Fishbone Diagram
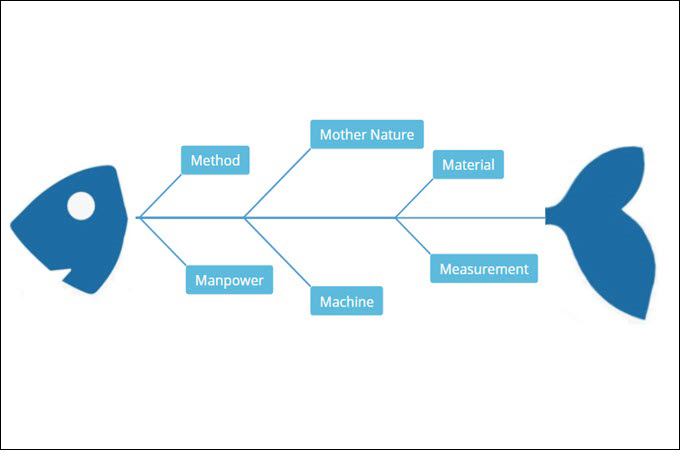
Identifying the elements that lead to variances inside a system is one of the first stages in generating a diagram. Ishikawa diagram refers to such fundamental aspects as the six M’s of manufacturing:
Manpower
Organizational and practical work performed by those involved in designing and delivering to the customer This is a rather uncommon “source” of a particular condition. When manpower is discovered as a source of an unfavorable consequence, it is frequently increased by a factor of 6 M’s.
Method
Regarding on Ishikawa diagram template, this method of the stage are delivering services operations that contribute to the processes that discover an excessive number of stages, desirable outcomes, and other actions that do not add or produce much benefit. Systems may be complicated and difficult to follow if they are not optimized, clarified, and standardized.
Machine
Under the Ishikawa fishbone diagram, the machine component is responsible in facilitating the underlying support system that is mismanaged or in the cable of delivering the target results due to technical or maintenance difficulties.
Material
Materials are commonly mismanaged because they have been incorrectly characterized, mislabeled, improperly stored, or out of date, among other reasons. natural resources, equipment, and materials needed to produce a particular end result.
Mother Nature
Ishikawa fishbone diagram also includes mother nature’s unpredictable and uncontrollable environment factors such as climate, storms, landslides, fires, and so on. Whereas many environmental elements are foreseeable and managed, there are certain inescapable climate issues for which some organizations are unprepared.
Measurement
Assessments, whether mechanical or automated, include physical measures such as distance, quantity, temperatures, tension, and so on. Measurements can be uneven at times, making it more difficult to utilize the data to draw repeatable inferences that facilitate the identification of a constant reason.
Free Online Ishikawa Diagram Templates
Using an excellent tool like GitMind, you create a high-quality Ishikawa diagram. This tool is also used to process many types of diagrams and flowcharts. In addition, this type of visualization is used to manage task systems and may help any business layout numerous procedures, assets, timetables, and tasks required to execute a specific work. Having said that, you can test out the template provided in this post.
Benefits of Using Ishikawa Diagram
The Ishikawa fishbone diagram provides a comprehensive view of a group’s underlying causes. A major proactive risk management task is the measure of risk in such fields. It may also construct a better hazard risk register on its own. It displays dangers, risks, and the link between them.
Conclusion
Above all, utilizing an Ishikawa diagram allows you to develop proactive risk controls by simply plugging in risk controls to causes and threats that do not yet have one. This strategy minimizes the uncertainty that leads to inefficient or unnecessary preventive actions. On that being said, it’s all possible by using a dependable tool like GitMind to create this strategy.
Leave a Comment