
A fishbone diagram is firstly used to analyze the possible root causes of the problem to be solved in production processes. The fishbone diagram is now widely applied in other sectors including manufacturing, marketing, service, etc. In other words, no matter what field you are active in, you have to make a fishbone diagram to solve a problem in a logical manner.
Although Microsoft Word and WPS had already built in some flowchart templates, the easiest method of creating a fishbone diagram is to start with a free online fishbone diagram maker, GitMind.
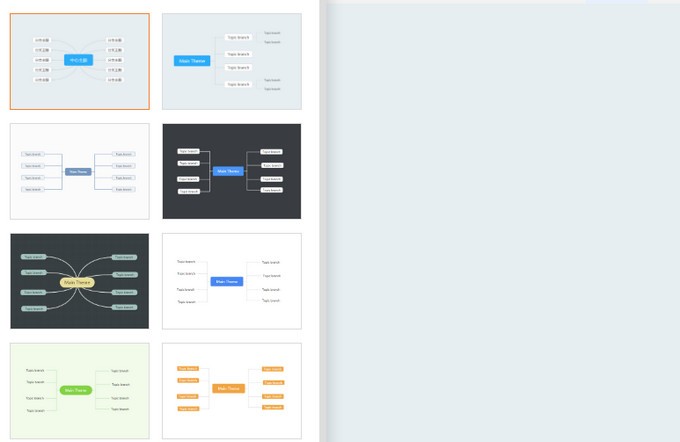
Make a fishbone diagram by GitMind
GitMind is a browser-based mind mapping application. GitMind is supposed to enable users to work and live with high efficiency and minimal effort. What can you do in just five minutes? After reading the following guide, you are going to have the capability of making an elegant fishbone diagram.
Step 1 Sign up
Sign up with your email address. It’s suggested that before you begin to create a fishbone diagram, register and log in to your account so that you can retrieve it instantly afterwards. If you wish to use its desktop version, simply download the program.
DOWNLOAD
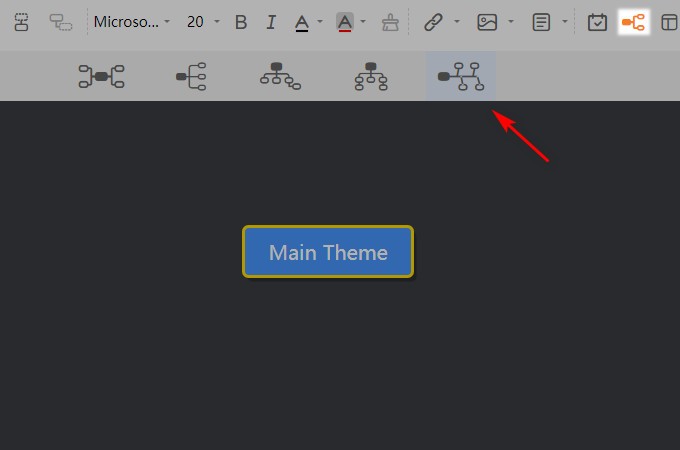
Step 2 Change the theme
Click “Theme” on the left of the canvas. Pick a suitable style for your diagram. The stylish theme would be a big plus for your work.
Step 3 Select the layout
Click “Layout” on the toolbar and select “Fishbone.” The layout of a diagram is equivalent to the body type of a human being.
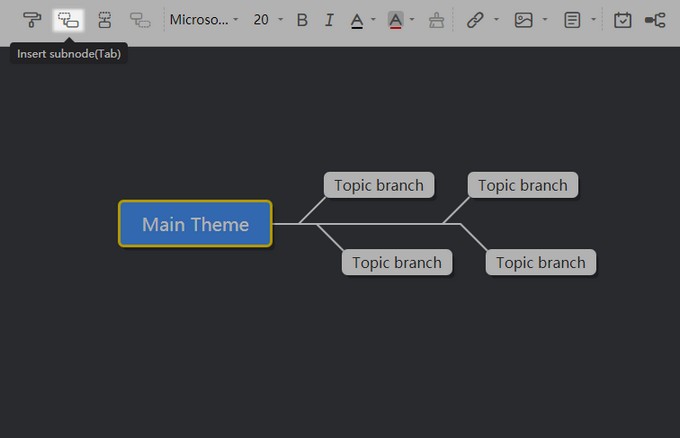
Step 4 Build the fishbone
Double click the “Main Theme” to fill in the template with the observed effect as the fish head. Press Tab to insert the sub-nodes as potential causes. It will automatically represent a fish skeleton.
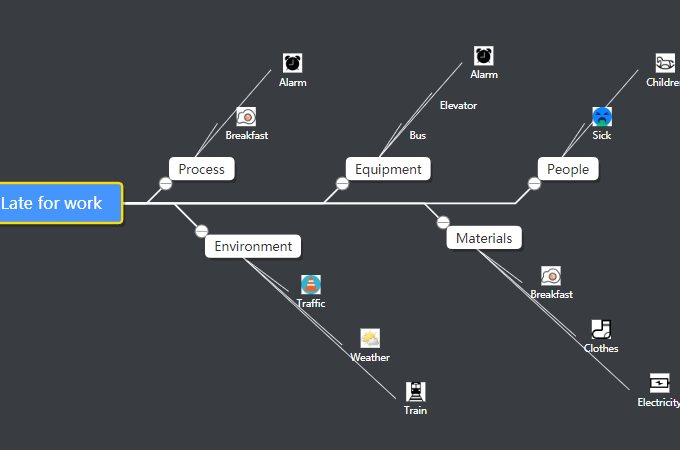
Note: The problem should be written as a question, for example: “Why are you late for work?”.
Step 5 Classify the causes
Clarify the categories of the causes as much as possible. Since the category works as a reminder for certain causes, a faulty omission would probably bring about inaccurate analysis.
Notice: There are some general categories, such as People, Methods, Machines, Materials, Measurements, Environment. If you are going to make a fishbone diagram dealing with other sectors, you can refer to some typical categories.
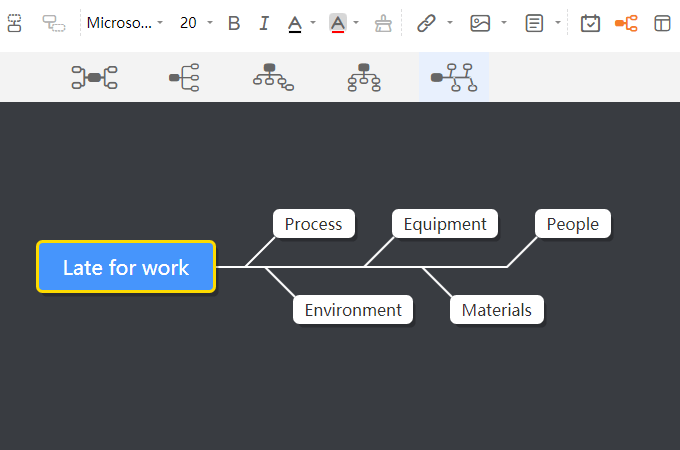
Step 6 Brainstorm
Now, it’s time for brainstorming. By yourself or with a team, keep asking why questions and dig deeper into the root causes. The following example is for your reference.
At the moment, you have a well-organized fishbone diagram. Additionally, what GitMind offers its users is not only a streamlined creative process but also free storage and the ability to share solutions. Whether exported as a link for collaborative work or as an image for reading only, you are free to start with GitMind and let it guide your work.
Tips for optimizing your fishbone diagram
- Organize a think tank to create a fishbone diagram. Instead of racking your brain, giving full play to collective wisdom is a more efficient way.
- Define the major categories of the causes clearly. “Well begun is half done.” The improper categorizations will take you roundabout ways.
- Brainstorm the possible causes as much as possible. The more causes your team notices, the more possibilities there are to solve the problem with a critical mind.
- Classify the possible causes logically and position them on the basis of priority. Build sub-cause branches for the major causes.
Conclusion
“Practice makes perfect.” Creating is easier when the method has been optimized. Do hope the above method helps you improve your own analytics. If you like this article, please give us a like. Share your tips for making a fishbone diagram in the comments box below.
Leave a Comment