
A Gantt chart is used to detail the progress of a project. It is primarily used by teams and organizations to properly track their working time. Using such type of chart is a good way to boost working efficiency. On that note, we listed some ways to make Gantt chart easily using the most common apps like Excel and Google Sheets.
4 Useful Tools to Create Gantt Chart
Microsoft Excel
As mentioned, one way to make a Gantt chart is by using Microsoft Excel. The application is present on almost every Windows PC which is convenient since you won’t need to look for another tool. However, since the tool is primarily used for it’s spreadsheets, using it as Gantt chart maker is not commonly practiced. Nevertheless, it is still one of its functions since it allows users to do so. On that note, here are the steps to create Gantt chart using in Excel.
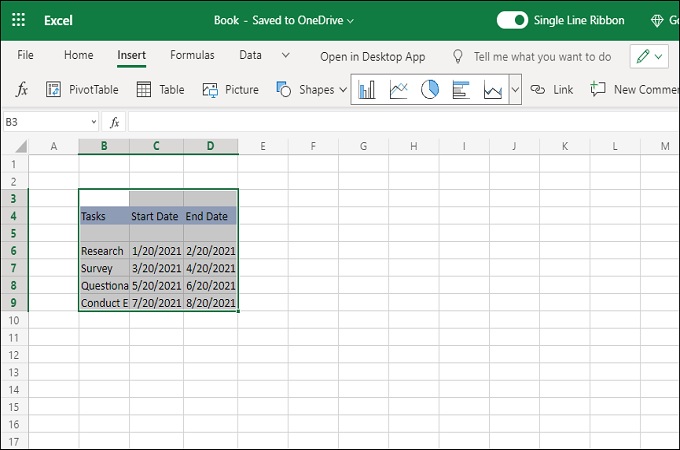
- Start by creating a table of the project start and end date. After that, assign the tasks to the individuals who will work on them.
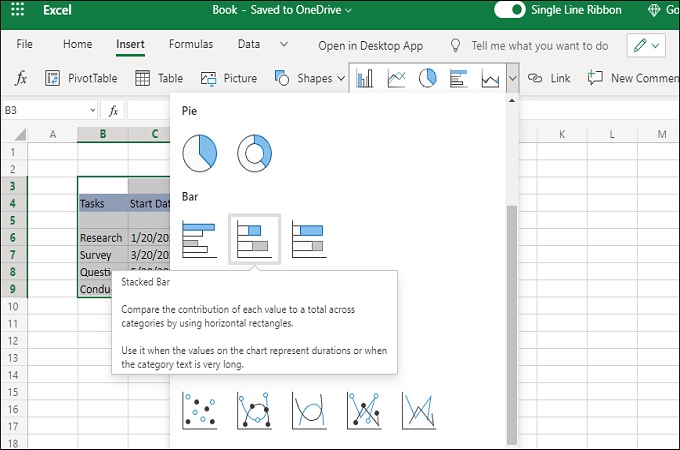
- Next, click on an empty cell anywhere in the spreadsheet, and then click the “Insert” option from the toolbar. From the same menu, click the “Bar” icon and select the “Stacked bar” from the “Bar Chart” menu.
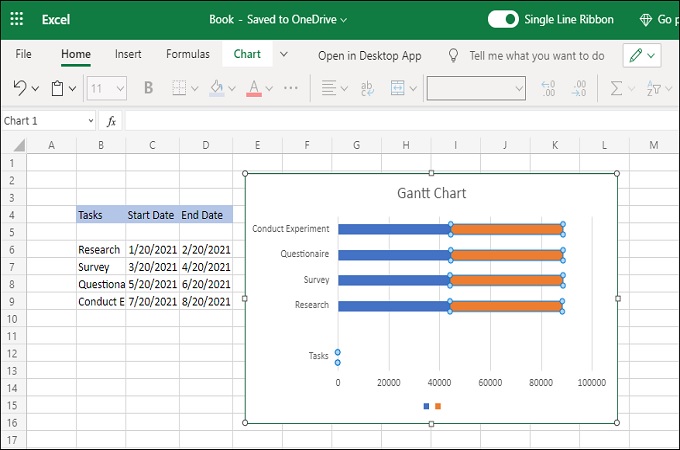
- Right-click on the floating window, and then click the “Select Data” option. From window that will appear, click “Add” and then add then enter the data on the pop-up window that will appear. Continue until all the Gantt chart is complete.
Google Sheets
If you want to learn how to make a Gantt chart using Google Sheets, then you are on the right page. Google Sheets is a tool similar to the Microsoft Excel and are very similar in functions. The only difference is that Google Sheets is web-based, and is accessible from a web-browser. Here are the steps that you can follow on Google Sheets.
- From the Google Spreadsheet, create a table with the information regarding the task. The basic information should be the task name, start date and end date.
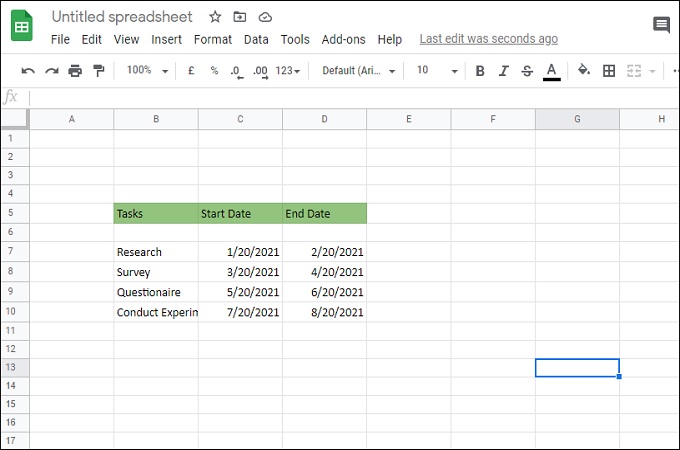
- After that, you will need to create another column, and then add the names of each cells, primarily “Task,” “Start day,” and “End day.”
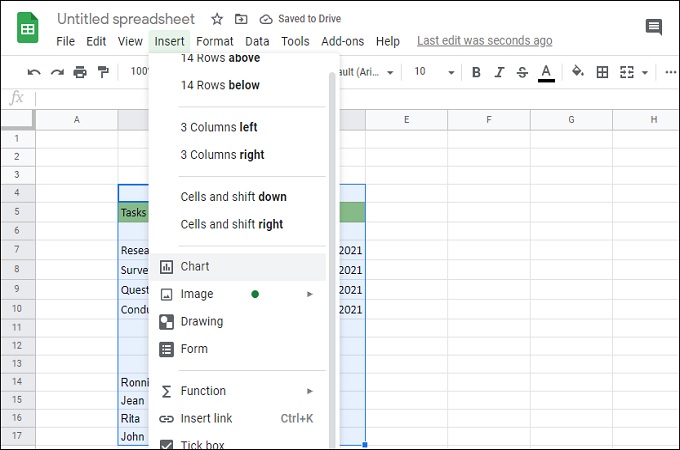
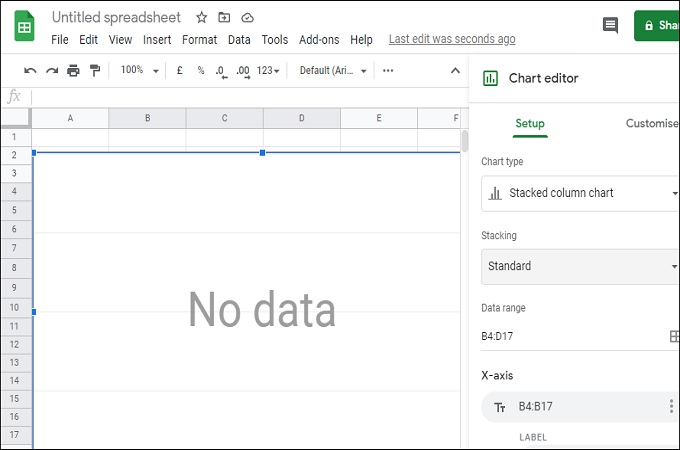
- Lastly, click the “Insert” tab and then select “Chart.” From the new window that will appear, click the drop down menu and then choose “Stacked Bar Chart.” This is the way to create Gantt chart online.
Microsoft Word
Another common tool that be used to make simple diagrams is Microsoft Word. Despite being a word processor, this application also supports diagram creation. There are many things that you can insert on each document pages like tables, graphs, and images. Another edge that it has over other tools, is the familiarity of users. Almost every one who uses a PC knows how to use the Word. That is why adjusting to using is as a tool to make Gantt chart is easy. Here are the steps that you can follow to make a Gantt chart in Word.
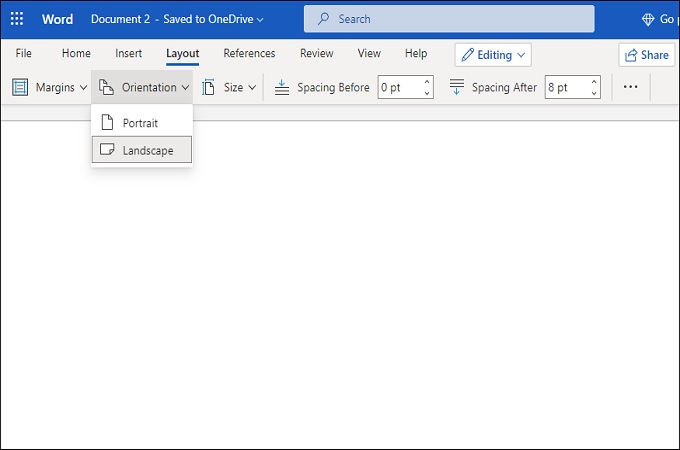
- Launch Word, and then change the page orientation to “Landscape.” After that, click the “Charts” option from the toolbar, and then select “Bar” from that window that will appear and choose the “Stacked bar” option.
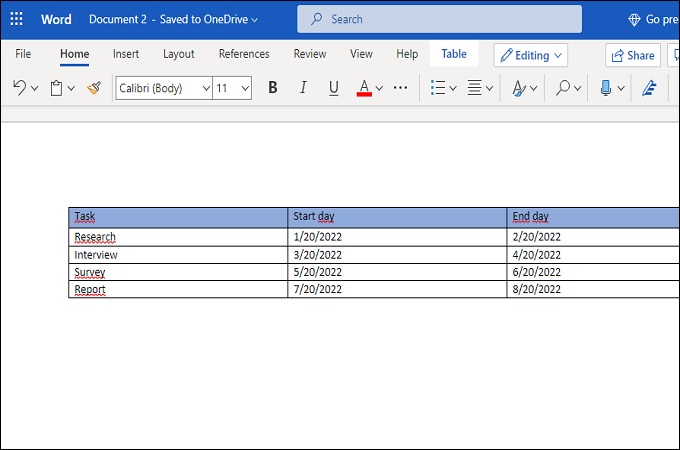
- Once the appears, you can start editing the Gantt chart by adding all the data that you have. You can also design it anyway you want.
- Lastly, save the chart on your PC by clicking the “File” tab and then selecting “Save.”
GitMind
If both applications are unavailable for some reasons, then you can use GitMind to do the job. This is a free online map and flowchart maker supported by most web-browsers. The lets you create charts and maps from scratch on top of using the ready-made templates from its library. You can also share your creation instantly via URL to your friends using this tool. Overall, GitMind is a great tool to make Gantt chart if the need arises. With that being said, here are the steps to use GitMind.
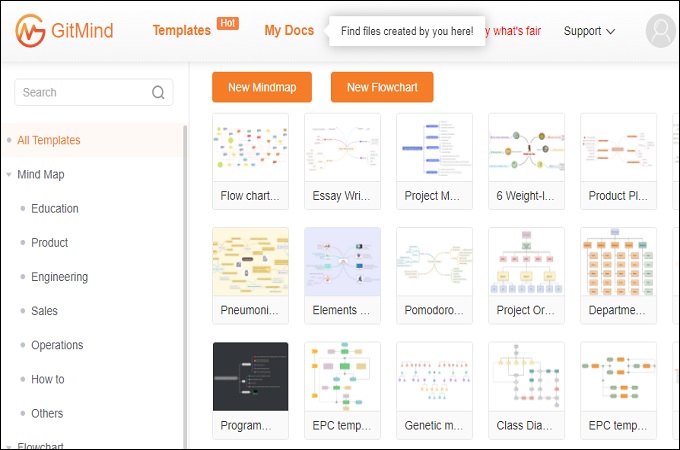
- Launch GitMind from you web-browser and then click the “Get Started” button. From the main-interface, click the “New Flowchart” button.
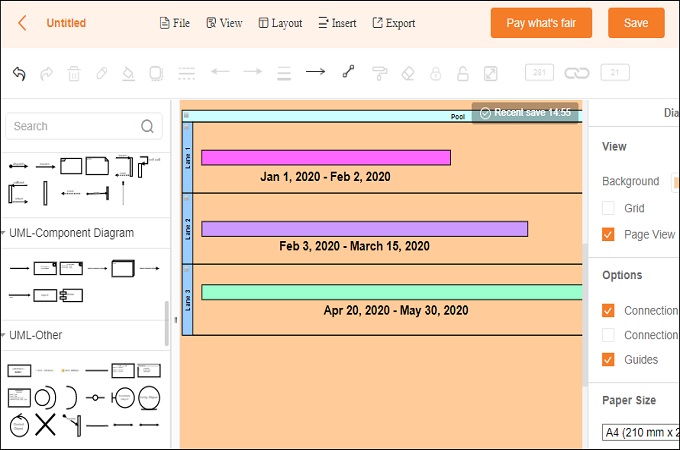
- Start editing your Gantt chart by from the editing panel, Use the available options to style the chart the way you want.
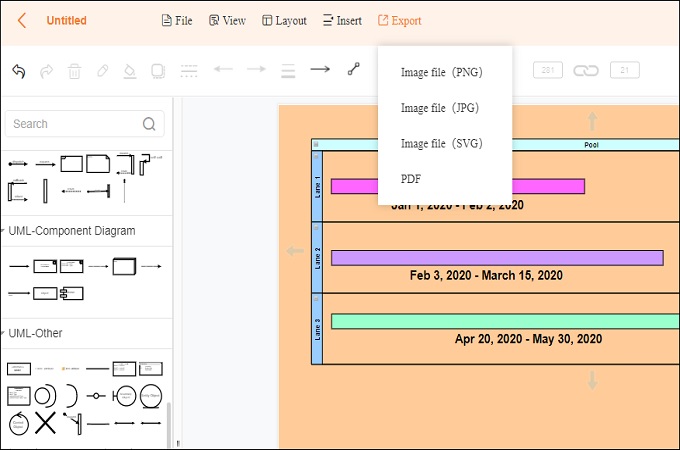
- Once done editing, click the “Save” button to save the chart on your cloud. Alternatively, you can save the chart on your local storage by clicking the “Export” button.
Conclusion
There are several ways to create Gantt charts, and one of the simplest is by using dedicated mapping and flowchart tools. GitMind for example, is able to provide many options that benefits you when creating Gantt charts and other types of diagrams. Of course, the other two solutions are feasible but you’ll have to do it manually. If its convenience you’re after, then you can use GitMind instead.
Leave a Comment