
Program Evaluation and Review Technique or PERT is a method that visualizes the information gathered for a project. The main purpose of this chart is to track the time spent on a project. If you will look at it, a PERT chart is highly similar to a Gantt chart. However, PERT is contains more that just time details, as it has other elements that are more technical in their own sense. If you want to learn what these other components are, then you are on the right page. Continue reading below to learn more information about this type of diagram, and how to make one.
Ultimate PERT Chart Tutorial
- PERT Charts in Project Management
- Components of PERT Chart
- How to Draw a PERT Chart?
- Editable PERT Chart Examples
PERT Charts in Project Management
As mentioned above, there is a distinction between PERT and Gantt diagrams. However, both of them are very useful when applied to project management since they both make good scheduling tools. On the other hand, many project managers prefer using PERT diagram since it details all aspects like completion time, work duration and hurdles experienced throughout the entire process. Compared to the Gantt chart, PERT was developed to provide a simple way to schedule complicated projects. Aside from that, PERT is visualized as a flowchart which is easier to follow and read compared to the bar graph design of Gantt. Lastly, a PERT chart is prepared before executing a project to help in designing a suitable working schedule.
Components of PERT Chart
Before proceeding to making your chart, it is important to learn what makes the entire chart. We are talking about the components of that makes up a PERT diagram.
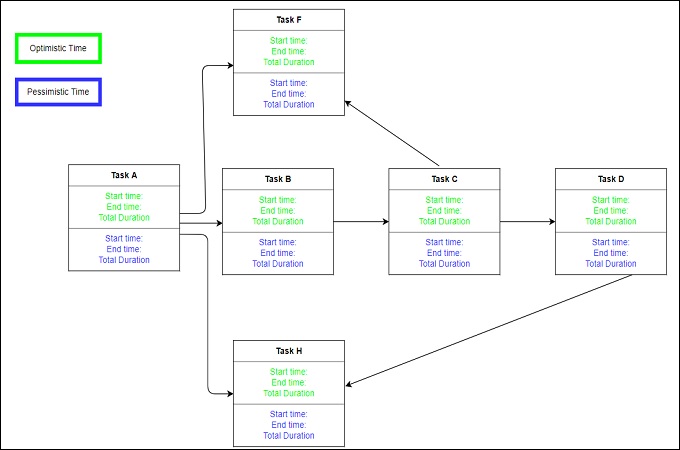
1. Optimistic Time – This is when everything is according to your plan. When a task is finished within the scheduled amount of time or sooner is called optimistic time.
2. Pessimistic Time – This is the entire opposite of the previous one. To put it simply, this is the entire time consumed to finish a task.
3. Most Likely Time – The best estimation that you can provide to get the job done. This is applicable in the sense that you will not encounter any problems along the way.
4. Expected time – This term refers to the realistic estimation of time that you can consume. This is the case if you put into consideration the problems that you will encounter along the way.
How to Draw a PERT Chart?
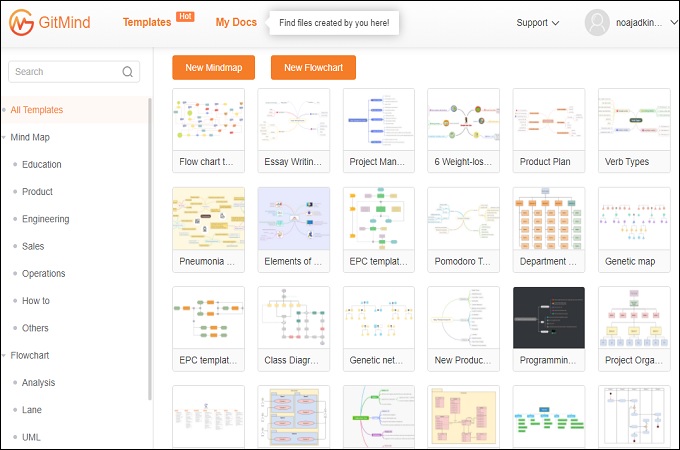
There are two ways that you can do to make this type of diagram. One is by drawing it manually by hand. The other one is by using chart creator software from a computer. Using either methods is all good, but for the sake of convenience, we recommend using a software. On that note, there are many software out there that you can use, like GitMind for instance. This tool let’s you create PERT chart online, since it is web-based. Aside from PERT charts, you can also make mindmaps, flowcharts, and many other types of diagram here. With that being said, here are the steps to draw this diagram.
- Launch GitMind from your web browser, and hit the “Get Started” button to open the tool interface. After that, click the “New Flowchart” button to reach the editing panel.
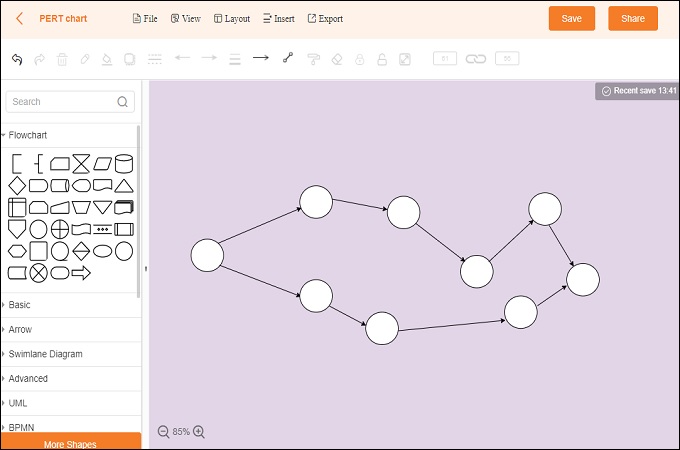
- Use the different shapes and elements that you can find from the right-hand side of the editing panel to construct your PERT chart.
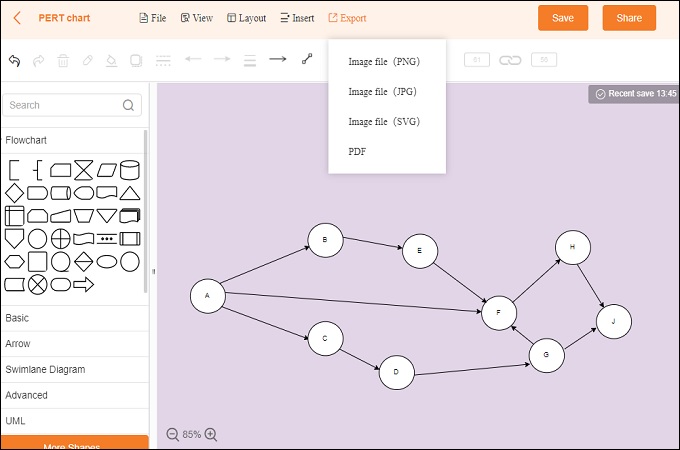
- Once done editing, you can save the diagram on your cloud by clicking the “Save” button. Alternatively, you can download the diagram to your PC by clicking the “Export” button.
PERT Chart Examples
If creating your own chart is not your cup of tea, then you can use ready-made diagrams online. GitMind provides various templates for different situations that you can edit instantly. Here are some sample PERT diagram that you can edit online.
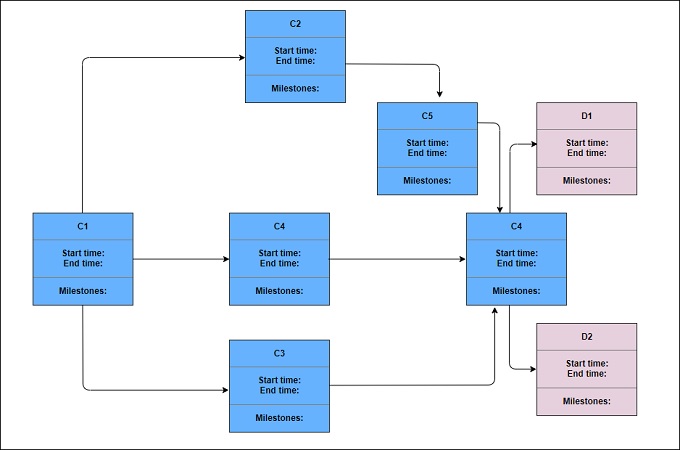
Task with Breakthroughs template
You can use this template to schedule a task with expected milestones. This will allow for great priority setting and let’s you focus on the most realistic tasks that you can complete in no time.
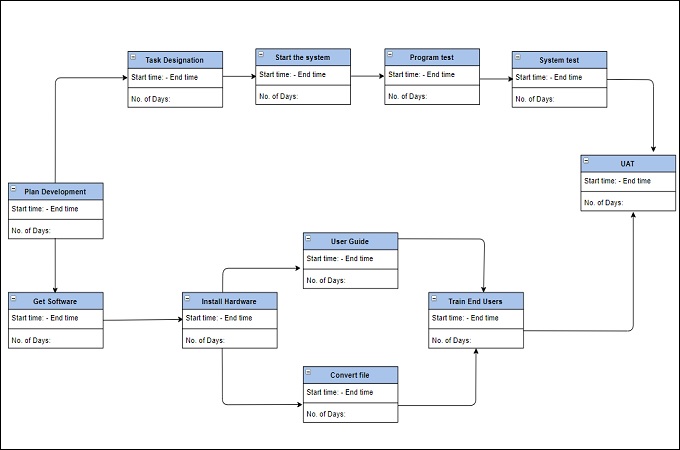
Project management template
Use this template to allocate tasks among teams with expected output. The nodes are mostly labeled with the task name with start and end date.
Conclusion
PERT diagram online makers are very present on the internet. All these tools provide convenience but don’t just pick one out of the blue. As mentioned, PERT is a very essential and critical part of project management. That is why you can use tried and tested tools, GitMind for that matter in order to get high-quality diagrams all the time.
Leave a Comment