
A state diagram is a visual representation of the process that happens in operating a machine within a limited amount of time. This is a type of UML diagram that is frequently used in the engineering field, especially in electronics. The main use of this diagram is to visualize the performance of an object when it undergoes operation. This means that it shows valuable data about the reaction of the machine, to various states that it undergoes in every operation. Continue reading below to learn more information about this type of diagram.
What is A State Diagram and How to Make?
Components of a State Diagram
Every diagram are made of several components. Like machines, these are necessary for the entire diagram system to work and be complete. On that note, here are the components that make up a UML State diagram.
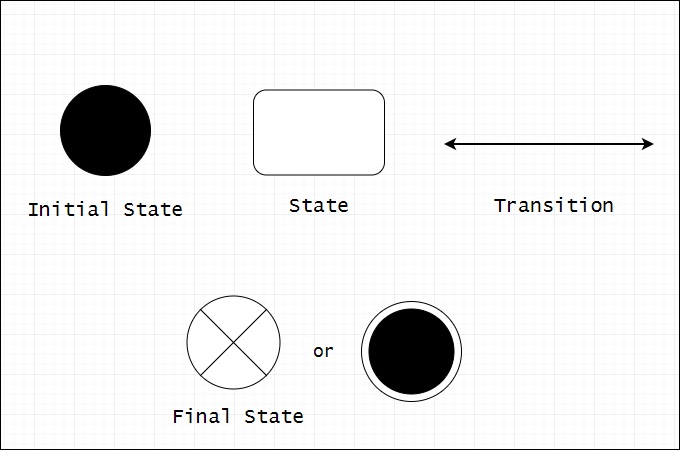
- Initial State – As the name suggests, this is the first state that the object will be at the beginning of the process. The symbol for this element is a solid circle.
- State – Next component that you need to include is the “State.” In every process, the object involved will enter a state or phase at one point. States are represented by rectangular boxes with round edges.
- Transition – This element depicts the shift from one state to another. This is represented by the arrows within the statechart diagram.
- Event – This is the general term for anything that can cause a transition to happen during the process in a diagram.
- Signal – Any message or signs that occur during the transition to a state is called a signal.
- Final State – This is the entire opposite of the initial state. The final state depicts the outcome that is expected from the object. It can be represented as a semi-solid circle or with a bull’s eye symbol.
How to Make a State Diagram Online?
Creating a diagram such as this one is a tedious task as it is very confusing. That is why you need fundamental understanding about its components first. Aside from that, an easy to use tool will be needed to simplify the creation process. With that being said, here are the steps that you can follow to create a UML state diagram.
- Launch GitMind from your browser. Click the “Get Started” button from the homepage, and the main-interface will appear. Next, click the “New Flowchart” button to switch to the editing panel.

- You can now start editing your diagram. First, search for the components that you need from the available shapes and elements within the tool. Arrange them accordingly from the editor.

- Label each components to add more details, and then apply the changes by clicking the “Save” button. Alternatively, you can export your diagram in various image formats by clicking the “Export” button.

Or you can also enjoy this tool using its desktop version, which you can get from the download button below.
DOWNLOADEditable State Diagram Examples
Making your own diagram is fine and all. However, it never hurts to have some ready-made ones that you can immediately use. That is the reason why we made some ready-to-use templates that you can utilize anytime. Here are some sample State diagram made using GitMind.
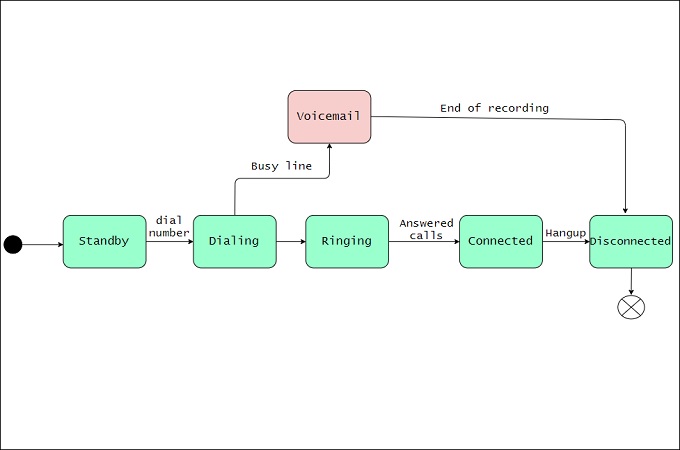
Phone State Diagram Example
This example shows the different phases that happens when we use a phone to call someone. This is a general example, and can vary for each call situations.
Oven State Diagram Example
The example shows the process that happens when an oven is being operated. From turning the timer on, up to the end state where the timer stops.

Conclusion
As mentioned, this is one of the most confusing diagrams that you can make. This is due to its technicality when it comes to its contents. However, intimidating as it may be, you should not be discouraged from making a State diagram, as there are tools that you can use. Aside from that, you can use the knowledge that you learned above to your advantage. All it takes is a few practice and you are ready to go.
Leave a Comment