
A Swimlane diagram is a process map that utilizes lanes to demonstrate a business process. The defining characteristic of this diagram are the parallel lanes that divides the entire chart. Alternatively called functional band on various platforms like Microsoft Visio, this is used to make process flowchart for each units of a specific business model. Although on other platforms like GitMind, you will easily find it by searching for the words swimlane. On that note, let’s dive deeper into what a swimlane diagram is all about below.
DOWNLOADWhat is Swimlane Diagram?
- Benefits and Usage of Swimlane Diagram
- Swimlane Diagram Components and Symbols
- Swimlane Diagram Examples & Templates
Benefits and Usage of Swimlane Diagram
Aside from being a great information organizer, a swimlane process map has other functions and benefits as well. Using it, you can analyze your entire business process by eliminating redundant steps if there are any. Not only will you efficiently save time, but will also remove unnecessary workload which consequently results in better performance. It is also possible to improve employee relations and task distribution using this chart because you have a general overview of all steps involved in performing tasks. Below are some of the other benefits of using this type of diagram.
Benefits of Swimlane Diagram
- Swimlane diagram allows all the members of the entire business process to see what the others are supposed to do. This is a great way to boost transparency among colleagues.
- Instead of a narrative direction, you can utilize this diagram to illustrate the complex instructions to people. This will simplify the task of instructing them in a manner that is more understandable.
- Using this diagram fosters effective communication between colleagues, as they will see who is responsible for a task. This way, they can directly ask that colleague if there is a misunderstanding or confusion along the way, simply by following the swimlane process map.
Swimlane Diagram Components and Symbols
In creating the right diagram, you will need to first understand what the components are. In any diagram like Swimlane flowchart, each shapes and symbols represent a certain function and has a definite meaning. In-general, Swimlane charts are one of the easiest to make since it only uses mostly basic components. While there are Swimlane diagram templates available across the internet, it is still worthwhile to know its components. To have a better grasp about the total aspect of this chart, refer to the list of components from the swimlane flowchart above.

- Start/End: This is symbolized by a rectangular box with smooth edges. It shows the start and end point of the entire process being depicted by the diagram.
- Process: There can be multiple processes within a single diagram, and these are represented by a regular rectangle labeled with the necessary process name.
- Conditional: The diamond shape symbolizes a question within the process.
- Manual Operation: This is for a process that requires manual input such as entering codes and things alike within the Swimlane diagram.
- Display: Notification or messages are represented by this symbol and is represented by an oval figure.
- Input/Output: This represents all the information that enter and exits the flow.
- Document: The presence of a document is represented by this shape.
- Multiple Documents: Signals that there are more than 1 documents that runs within the system.
- Start Loop: Signals the beginning of a loop within the process flow.
- End Loop: Signal that the loop has ended in the Swimlane process map.
Swimlane Diagram Examples & Templates
There are many templates that you can find on the internet. Among these are various types of swimlane flowcharts. On that note, here are some sample Swimlane diagram template that you can use instantly.
- Software Development Swimlane Diagram

This example illustrates the process of developing software applications for PC. From the development process, up to the actual coding, you will be able to see the meticulous process to make one simple software.
- Opportunity Flowchart – Software installation
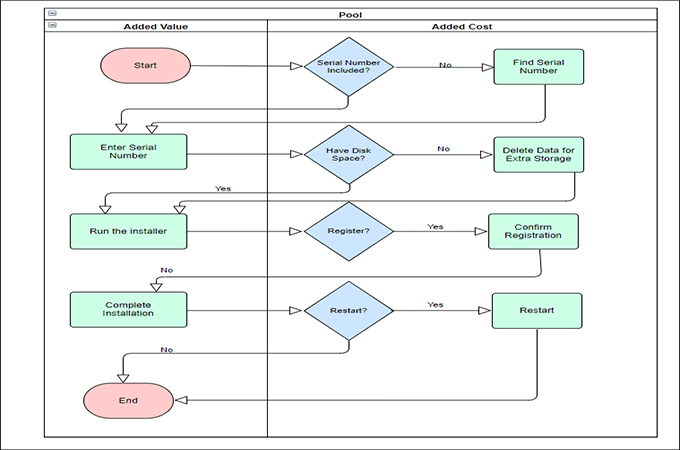
Opportunity flowchart provides an idea between opportunities happening within a process. In this example, we showed the opportunities when installing a software. To be precise, it shows the process between a successful and unsuccessful software installation.
- Recruitment Process

This swimlane diagram example illustrates how a request for personnel recruitment happens. From the initial stage, up to the actual hiring process is clearly shown. Tasks are also clearly distributed to the each respective departments.
Conclusion
Knowing the meaning behind each symbols is the first step towards making effective swimlane diagrams. Not only will you be able to properly express the flow of processes, but you can also use it to analyze your own work flow. That is why the next time that you need to use a Swimlane diagram, then feel free to use the templates above.
Leave a Comment