
Pie chart deals with statistical data usually drawn with a circle that is divided into slices called segments. These segments display a contribution of each category. Moreover, pie chart is best to use you have only one set of data to compare. Also, using a pie chart really works well if you want to show categorical data to see room for improvement within a business, show profit, exposure, etc. Here in this post, we’ll show you how quick it is to create pie chart online, in Word or Excel.
Practical Ways to Create Pie Chart
Microsoft Word
Microsoft Word allows gives you the ability to create several charts in just a few simple clicks. Aside from pie charts, this enables you to make line charts, bar graphs, and area charts. In addition, you can customize the appearance of the chart. This includes changing the color, font, or apply 3d effects to your chart. Apart from that, you can use this tool whether you are offline or online to make different types of charts. That said, the following are the steps on how to make a pie chart in Word.
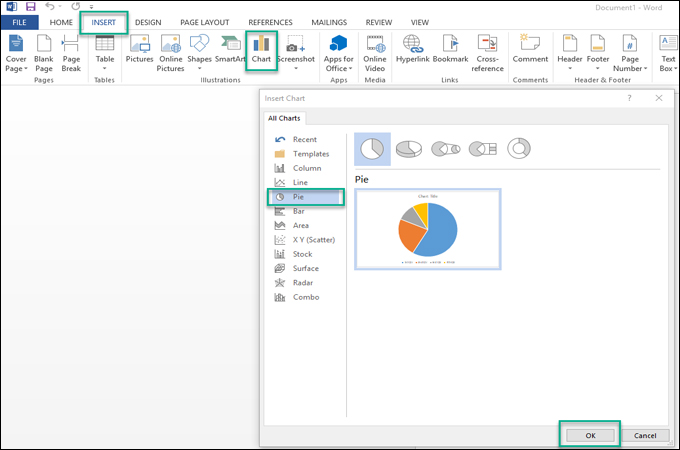
- First, launch the Microsoft Word on your computer and then go to the “Insert” tab and select “Chart.” Now, choose “Pie” from the categories section on the left side and click “OK.”
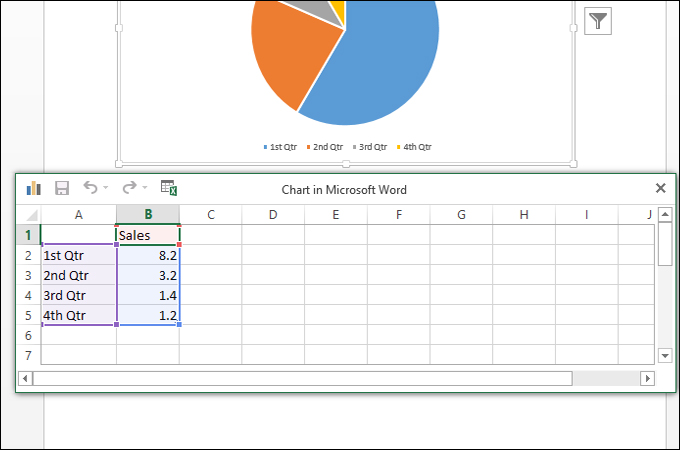
- Next, choose among the type of pie chart you want to create. Once done, an excel spreadsheet will then appear. Start adding and editing your data in the chart dialog box.
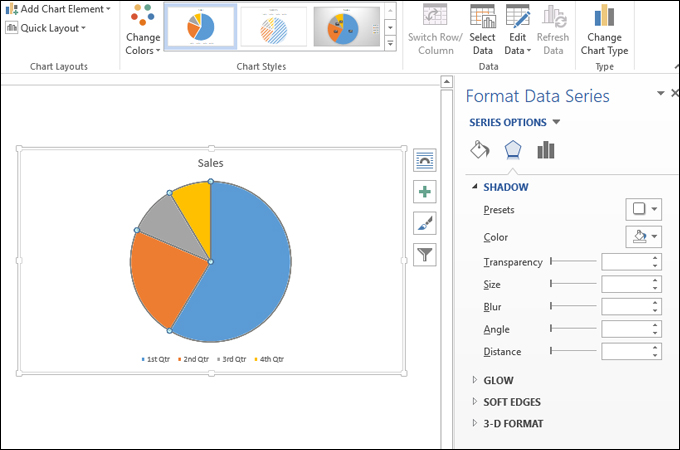
- To customize, simply double click on the chart, and a set of options will appear on the right panel. Here you can edit the fill of the segments, apply shadows, glow, 3d-format and save it to your PC.
Microsoft Excel
Another yet worth considering tool to create pie chart in Microsoft Excel. Just like Word, this lets you produce various kinds of charts and effectively choose the right illustration for the data you want to represent. Aside from that, you can also import external data into Excel if you need to retrieve overwhelming data volume. This is a convenient way to create charts since all you have to do is to input data and Excel will automatically do the work for you. On the other hand, here’s exactly how to make a pie chart in Excel.
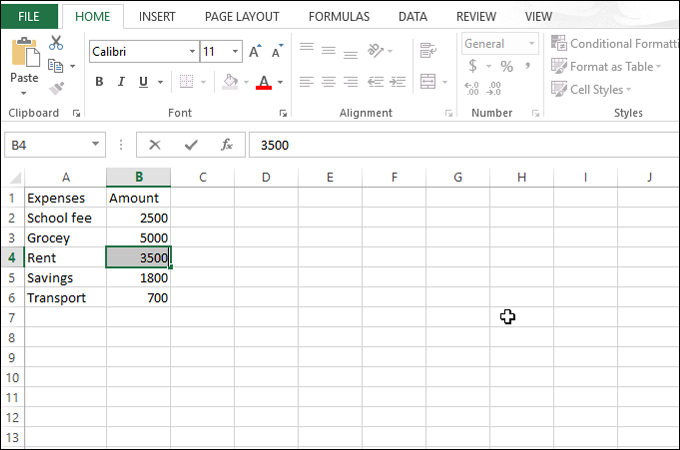
- Open a new worksheet on Excel. Import the external data or manually add the necessary data like categories, values, and other details for the pie chart.
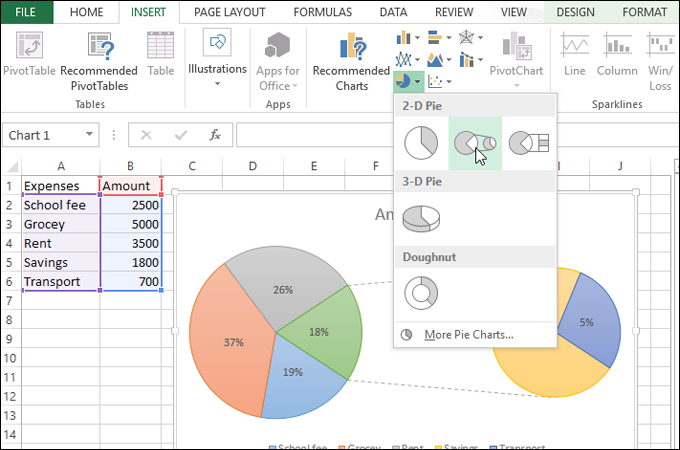
- Select the area on the worksheet where you input the value and go to the “Insert” tab. Click the “Chart” icon choose from 2-D, Pie, 2-D Pie of doughnut suitable for the pie chart you want to make.
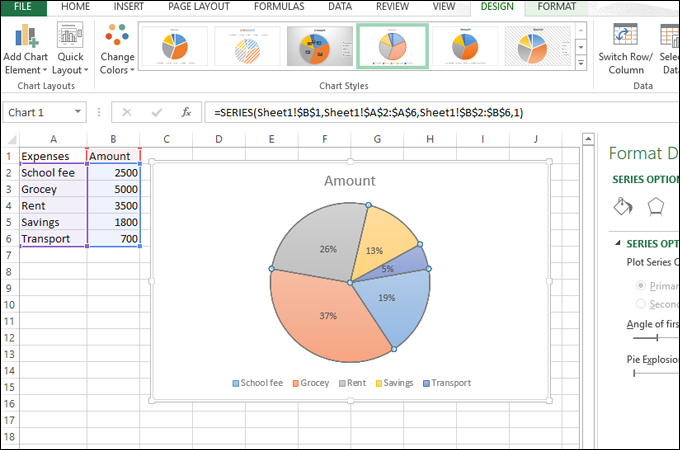
- You can further edit it by double-clicking on each segment. You will be directed to the “Chart Tools” where you can format the chart and add elements such as axis, data labels, trendline, or change the color of the pie chart. Once satisfied, save the chart.
GitMind
If the above solutions do not suffice your needs, this next tool to create pie chart online is probably for you. With GitMind, you can create charts online using just a browser and even use it on your mobile device to create mindmaps. Furthermore, the program comes with a variety of template choices to choose from according to your requirements. After creating and editing the chart, you can export it as a PDF, JPG, PNG, or SVG file. If you want to learn how to create pie chart using this tool, follow the steps below.
- Access GitMind using your browser and click the “Get Started” button from the main page. From the templates page, click on the “New Flowchart” button.

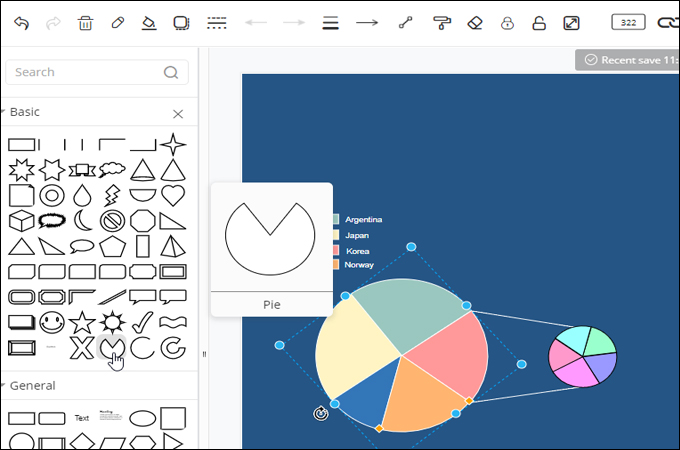
- From the shapes section, open the “Basic” folder and select the pie symbol. You can resize the slice of pie and adjust the scale, and the angle accordingly.
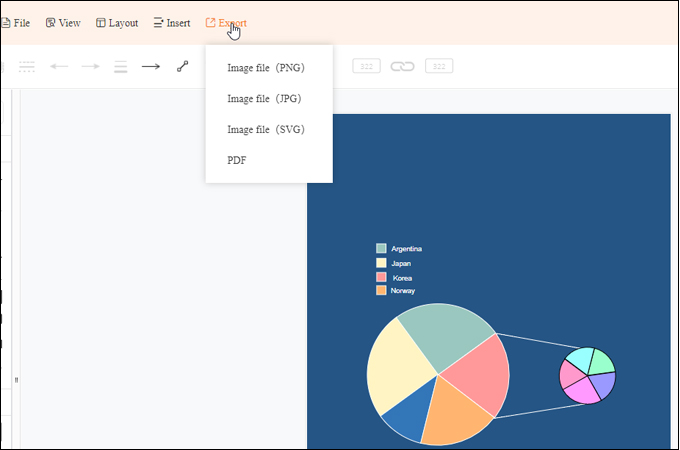
- If you want, you can add text and place it inside the pie slice, and create a legend from the text and shapes available. Lastly, modify the color, font text, and other properties and export the file to an image or PDF file.
Or you can also create a pie chart using its desktop version that you can get from the button below.
DOWNLOADConclusion
Pie chart is one of the most common visual tools to represent statistical information with the colorful and easy-to-understand organization of data. Hence, this is popular among businesses and mass media. The good thing is you can create a pie chart without the need for any special tool. There are online or readily available tools on your PC that can help you get this job done.
Leave a Comment