
A data flow diagram is a chart that visualizes the flow of information within a business network. It is primarily used to depict the route that information travels before reaching its destination. It is usually confusing to read this type of diagram but is an essential part of any business model. The reason is that it helps users and consumers understand the entire process of that specific business. This reduces misunderstandings between businesses and their clients.
Get to Know Data Flow Diagram
DOWNLOADData Flow Diagram Symbols
As previously mentioned, a DFD diagram is one of the most confusing diagrams out there. One reason is the various symbols present within the chart. Needless to say, if you want to fully understand how to read this diagram, then you need to learn the meaning behind each symbol. There are four basic symbols present within every DFD, and they are as follows:
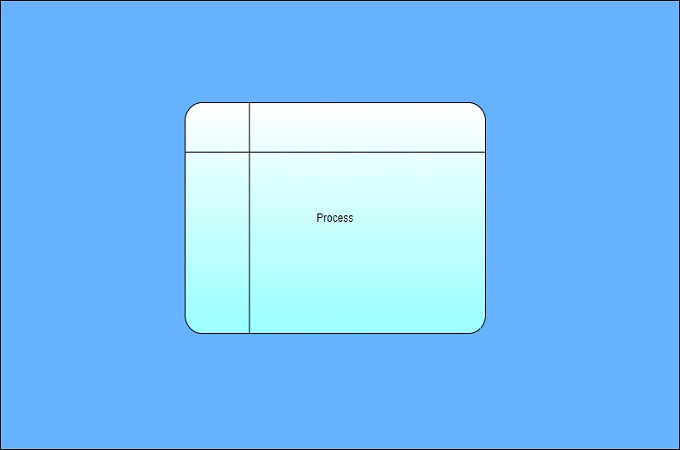
- Process – This type of symbol is critical since it indicates the exact action that is being performed. Diagrams are not limited to just a single process, since they the entire sequence of actions within the network. In naming a process for a data flow diagram online, it usually starts with a verb, followed by a noun. The Process symbol is represented by a rectangle with rounded corners.
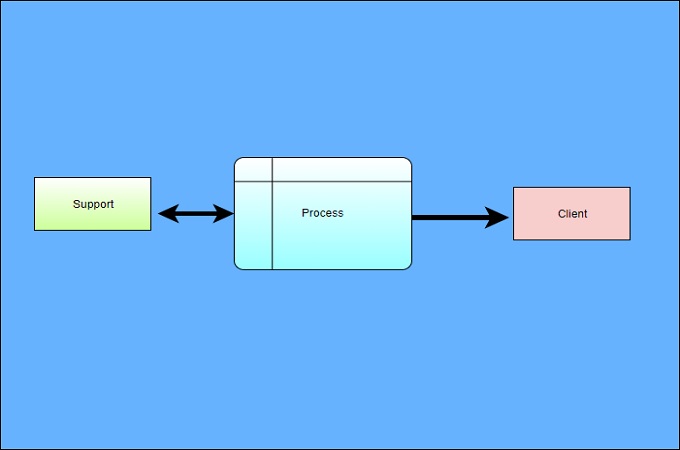
- Data Flow – Data flow shows the direction the process is headed. It is represented by an arrow that points either left or right. Each direction represents data flow. For example, outgoing arrows show output data flow, while incoming arrows show input data flow from your data flow chart.
- Data Store – Storage is essential in any data management system. That is why it needs to be included within your data chart.
- External Entity – The last symbol that should appear on your DFD is the External Entity. This represents a related person or group that provides information. However, that is their only purpose as they are not included in any decision-making process.
Types of Data Flow Diagram
There are two types of categories of online data flow diagrams. These are the Logical and Physical DFD.
- Logical Data Flow Diagram – This type of DFD focuses on the business itself. In general, it depicts the flow of the data within the business. It doesn’t concern itself with external factors such as hardware, location, and other physical entities.
- Physical DFD – As the name implies, this type of DFD shows all the implementations within the system. That includes computers, cable lines, software, and external entities like people and organizations.
Data Flow Diagram Example by GitMind
Food Delivery System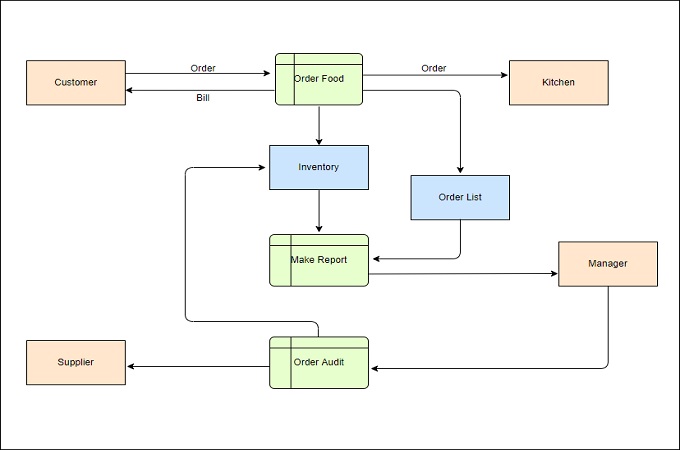
This example shows the process of receiving a food delivery order. The data flow diagram clearly shows the Customer using the Food delivery system and them responding back. It also shows the system reaching out to the supplier and manager at the same time. Once everything is confirmed, the kitchen will make the order and will respond to the system for delivery.
Customer Service System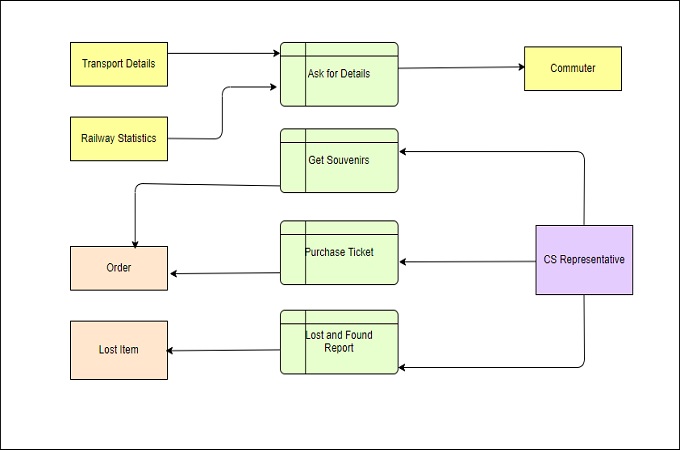
This data flow diagram example shows the interaction between the Customer Service system of a railway, and the CS representative and Commuter. It shows that the system serves as the bridge between the representative and the customer.
Trading Platform System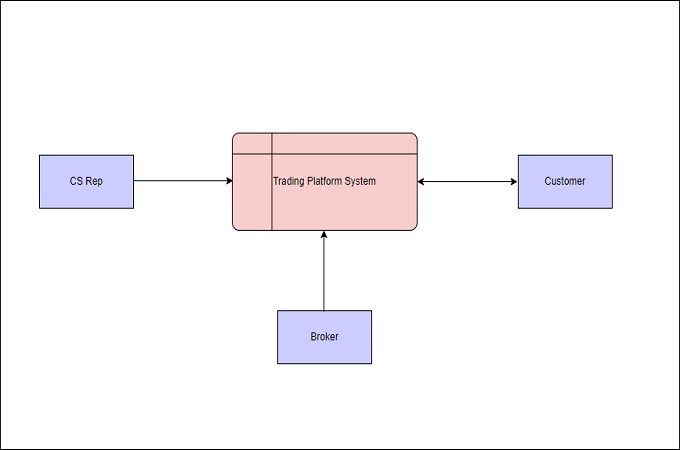
Lastly, this example will show you the flow of data between Trading Platforms and the Customer. It also shows that a Customer Service Representative, together with a Broker, are also in touch with the system.
Conclusion
A DFD diagram is really hard to understand, especially if it’s your first time seeing it. Hopefully you learned the fundamentals from this post and can comprehend what DFD’s are communicating. The information above clearly states the purpose, and definition of a data flow diagram. Now, if you are interested in making your own diagram, then you can use GitMind and start making these types of diagrams effortlessly.
Leave a Comment