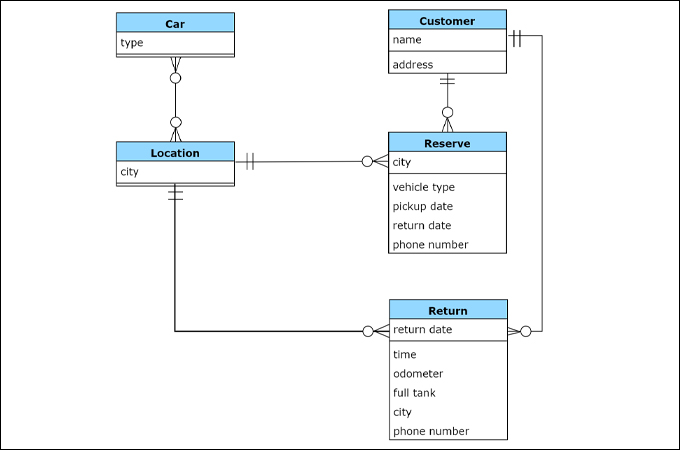
An entity relationship diagram or commonly known as ERD is a chart that shows entities within a database system. It is a tool that you can use to check if there are any inconsistencies in your program. By checking, you can then formulate a possible fix for them to avoid future inconveniences. Detailed ER diagram examples often contain all essential parts with other features. However, there are some that contain simple details but are still useful depending on the purpose. With that being said, we will dig deeper into this type of diagram as well as its components. We will also provide you with some ERD examples that you can edit and download at the same time.
Free Downloadable ER Diagrams Examples and Tutorials
ERD Notations

An entity-relationship diagram consists of three basic elements such as entity, relationship, and attribute. Along with these are more components based on their main elements like weak entity, multi-valued attribute, and many more. Other notations used to make ERD diagram examples include cardinality and ordinality to define relationships in numbers. Here are brief explanations about each component.
Entity- this represents the name of an object, person, thing, event, or place where data is stored. This is usually represented by rectangles.
Weak Entity- unlike a strong entity that is defined by its attributes, a weak entity solely depends on the existence of another entity.
Attribute- refers to the unique characteristic or property of an entity.
Derived Attribute- refers to an attribute derived or based on another attribute.
Multivalued Attribute- a type of attribute that can have multiple values.
Relationship- defines the interaction between two entities.
Cardinality- this refers to the occurrences of a relationship. In particular, it specifies the maximum number of relationships between two entities.
Ordinality- describes whether a relationship is mandatory or optional. It is also used to determine the absolute minimum number of relationships.
5 Downloadable ERD Examples
If you want to draw an entity relationship diagram example, here are some examples to easily get started.
- Hospital Management System ERD Example

This example illustrates how a hospital manages the bill of a patient. There are four entities in the entity-relationship diagram. This includes patient, procedure, physician, and insurance company. Each entity contains a list of attributes to describe its characteristics.
- Software Engineering ERD Example

This is an ERD diagram example application for an enrollment system. It gives the reader an idea that a student can have one or many courses, there’s only one seat allotted for a student, a teacher can have one or many courses to handle, and so on and so forth.
- Car Rental System ERD Example

ERD examples are also helpful for business information systems like car rental systems. This helps you visualize and analyze data or discover and identify issues when designing a new system.
- Database ERD Example

This provides an overview of what an ERD of an actual database looks like. With it, you can easily understand the structure of a database. Moreover, this template will help you how to identify the primary key and foreign key attributes.
- Chen ERD Example

You may also visualize a database using Chen notations just like the given entity relationship diagram example above. This is especially useful for teaching-learning situations as well as for the presentation of data.
How to Make ERD Diagram Online?
Now that you learned the essentials of an ER diagram, it’s time to try it yourself. You can actually design this diagram manually but an ER diagram tool will help you save time and effort. GitMind provides the elements and icons to create many types of UML diagrams including ER diagrams. That said, here are the steps to make your own ERD diagram example.
- Launch the official page of the tool on your favorite browser. Then, hit the “Get Started” button to use the online version. If you want to use its desktop version, download the tool.
- Now, open the flowchart editor by clicking the “New Flowchart” button from the templates page.
- Analyze the data structure of the existing system you want to visualize. After that, insert rectangles to represent the entities and add text to put a label.

- Now insert lines between entities and label them to show the relationships. In other cases, you could also insert a diamond shape on top of the line. Add the attributes of entities by grabbing some ovals.

- Add cardinality by identifying whether the relationships are 1-many, many to many, or 1-1. Finally, export the ERD diagram example to an image or PDF file.

Tips:
If you don’t know how to start your ERD, you can use Gitmind’s AI to generate a simple guide by using prompts. You can then edit the result accordingly.
Conclusion
ERD diagrams are indeed useful, not only for presentation but for practical purposes as well. This is evident in the various kinds of ER diagram examples in existence. On that note, it shouldn’t be hard to make one if you are using a tool that provides the elements required. Alternatively, you can also download ERD examples if you are on a tight schedule. On that note, we hope that the ones we provided are helpful to you in many ways than we imagined.
Leave a Comment