
Venn diagram is a visual representation consisting of overlapping circles to show a comparison between two things. Each circle contains features or characteristics of an entity or a collection of objects. Using this illustration, you will be able to build comprehension of complex ideas and summarize information with much clarity. In this post, we will walk you through the easy steps to make a Venn diagram. We’ll be using online and easy to use tools for your convenience. Follow along to create your own Venn diagram.
Easy and Practical Ways to Create a Venn Diagram
Make a Venn diagram in Microsoft Word
When creating a Venn diagram, you have the option to use online Venn diagram makers, or by using common apps on your PC. For example, Microsoft Word will be enough to do the trick. If you have this software installed on your computer, you will be able to create a Venn diagram in no time. See the guide below to make this diagram.
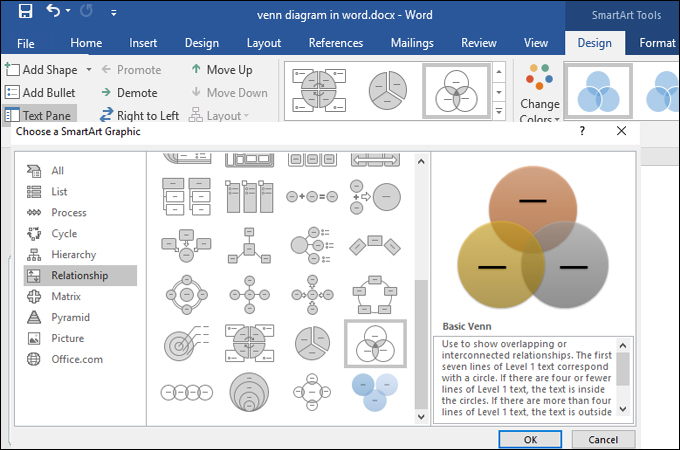
- Launch the Word app and go to SmartArt Graphic Window. Simply navigate to “File” > “New Document” > “Insert” tab. From the Insert tab, you will see the SmartArt Graphic window and select the Venn diagram under the “Relationship” category.
- Next, open the text pane by clicking the arrow icon and paste or type the information of your entities. Now, use text boxes to insert text onto intersecting areas of circles to make a Venn diagram.
- Once all information is added, you can proceed to customize your Venn diagram. Right-click on the circle you want to style and choose, Format Shape, and customize the fill style, line style, color, and then you save a file as usual.
Make a Venn diagram in Microsoft Excel
Alternatively, you can use Excel to make a Venn diagram so you don’t have to leave Microsoft’s environment. It does not only allow you to store and organize data, but you can also use it to create basic diagrams. The process of creating the diagram using Excel is almost similar to Word. To get started, follow the steps given below.
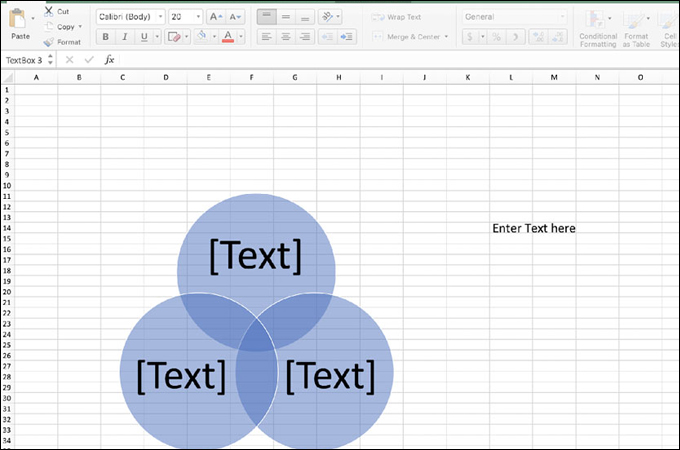
- Initially, you need to start with a new Excel document. Go to the Insert tab and select SmartArt. The SmartArt Graphics Menu will appear showing a list of diagram categories. Select the “Relationship” menu and choose the Venn diagram template to quickly create a Venn diagram.
- Now edit your Venn diagram template by changing the text, font style, size, and color. You may also add another circle by clicking “Add Shape”.
- Draw text boxes and fill them in with your data. After that, place them onto appropriate circles to add content. You can then style the diagram by changing the color of the circles, size and save the final output.
Make a Venn diagram in Google Docs
Moving on to our third solution, we have Google Docs. This is a good alternative for users who want to learn how to create a Venn diagram online. It is completely web-based and free to use. In addition, it allows you to edit a new document or an existing document. As long as you have a Gmail account, you will be able to enjoy the Google Docs suite. Learn how to make a Venn diagram in Google Docs by following the brief guide below.
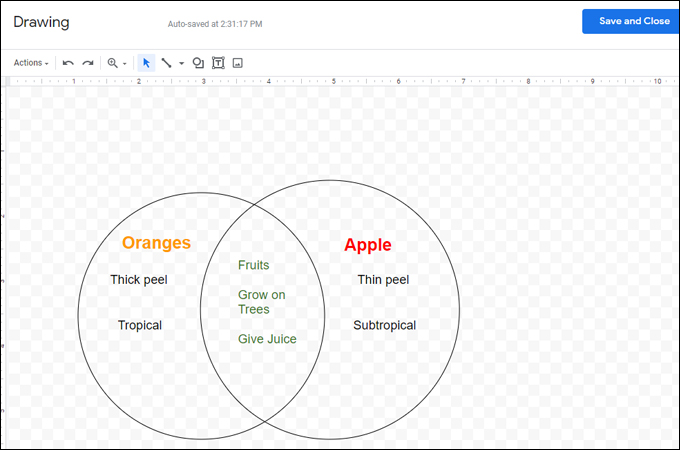
- Go to Google Docs on your browser and open a new document. Click “Insert” on the top menu and hover your mouse to “Drawing” and select “New.”
- From the drawing panel, click on the “Shapes” icon and add circles. To add content, insert text boxes, and add text or numbers.
- Once done, click the “Save and Close” button. To make some changes, double-click the drawing to enter the editor. With it, you will be able to easily create a Venn diagram.
Make a Venn diagram in GitMind
If you are looking for a tool dedicated to creating diagrams including the Venn diagram, then you should consider using GitMind. The whole interface is easy to navigate. Using its intuitive editor, it will help you make a Venn diagram online without any hassle. Aside from that, you can use it to create mind maps, flowcharts, and other visual representations. Even more, all projects are saved on the cloud without expiration. Here’s a step-by-step instruction on how to create a Venn diagram online using GitMind.
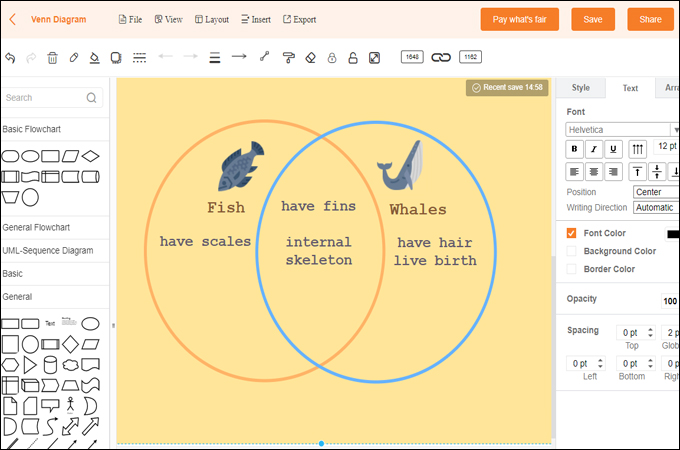
- First, go to GitMind’s official site using any browser and hit “Get Started” from the main page for its web-based tool. If in case you want to use its desktop tool, simply download and install the tool on your computer.
- Then, click “New Flowchart” to access the editing panel. Drag-and-drop shapes and remember to uncheck the “Fill” option to show the overlapping portion of circles.
- Add text by clicking the “Insert” button and select “Text.” Type the content of your Venn diagram and place them according to the categories they belong to. You can export the project as an image or PDF file or keep it in the cloud.
Conclusion
Now you know how to make a Venn diagram using Word, Excel, and Google Docs. Thus, if you want to visualize information and show how things are alike and different, you may use the suggested tools. Alternatively, GitMind is a great tool for building various types of diagrams including Venn diagrams. It’s free to use and has an intuitive interface to create professional diagrams and without any difficulty.
Leave a Comment