A Sipoc diagram is a detailed table that illustrates the inputs and outputs involved in a single process. The term SIPOC is an acronym for suppliers, inputs, process, output, and customers. Unlike your regular step-by-step chart, this diagram features a comprehensive list of elements involved in the process. In general, this type of diagram summarizes the entire output process to make it easier for customers to understand. For more information, we provided some additional pointers below, which will help you further comprehend this diagram.
What is the SIPOC Diagram
Elements of a Sipoc Diagram
As mentioned above, SIPOC is an acronym for the elements that make up the entire diagram. In order to make an efficient diagram, it is essential to know the meaning and uses of each element. Below are the elements of a SIPOC diagram, and their respective definitions.
- Suppliers – This column contains the names of those that provide the supplies that will be used in the process.
- Inputs – The Input column is where you will add the list of ingredients, materials, and information needed to proceed with your goal.
- Process – As the name suggests, you will need to list down the step-by-step process here.
- Outputs – This part is where you will supply the finished product or service after following the step-by-step guide.
- Customers – Lastly, you will have to list down your target market in this column. List down all customers who will benefit from your product or service.
How to Complete a SIPOC Diagram
Completing this type of chart is easier than it looks. You’ll need to provide the detailed information required for each part. To do so, simply enumerate all the essential elements required in your Sipoc chart. Below are the steps that you should follow to complete one chart. You can also use ready-made templates or you can design your own using a simple tool like GitMind. Using such a tool will give you the capabilities to make various types of diagrams including Sipoc, flowcharts, and mindmaps.
- As seen from the sample above, we will need to start with the name of the chart. Then we can proceed to create the five-column heads, and then label them according to their corresponding meaning in the SIPOC acronym.
- Next, fill out each Sipoc analysis column with their respective information. On the “Process” column, draw two lines and then create another set of boxes that you’ll need to fill out as well.
- Lastly, proceed to fill out the information required for the two remaining columns in the diagram.
SIPOC Diagram Templates
Here are two diagram templates that you can immediately use to save time and effort.
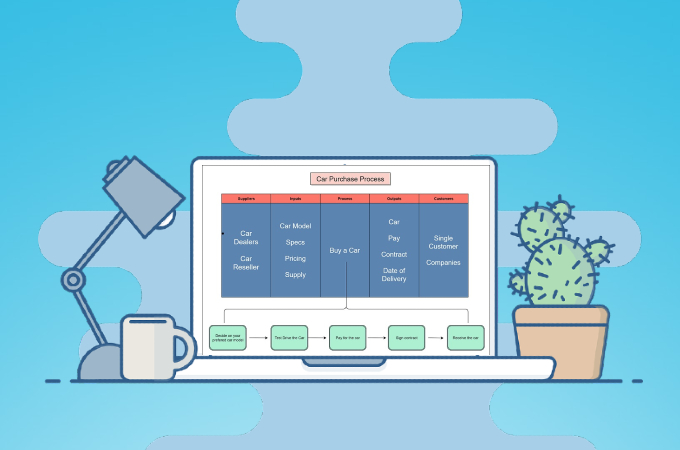
1. This template shows the process involved in dealing with cars. You can use it as it is if you prefer, or alter its contents depending on your line of business.

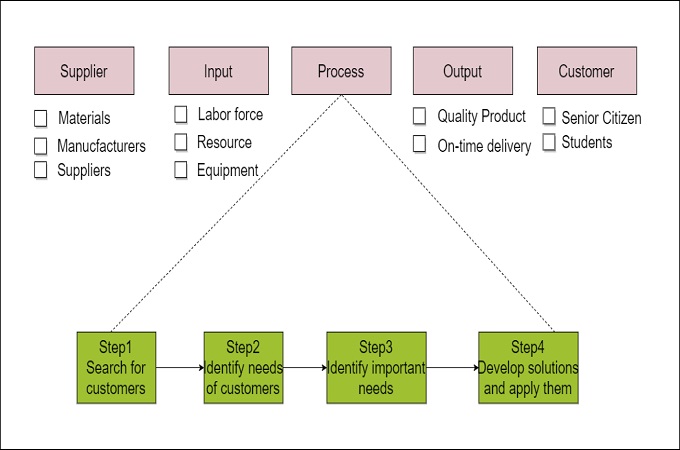
2. This template offers ways to improve customer experience. It explains how a firm or agency can identify factors that greatly benefit their customers, and then apply them.
Conclusion
A SIPOC diagram is useful in various ways. It’s one of the most flexible types of diagrams, which is why it is frequently used despite its intimidating appearance. However, if you want to fully utilize this diagram, you need to familiarize yourself with the fundamentals first. The above information is all essential and will benefit you a lot if you choose to go with a SIPOC diagram in the future.
Leave a Comment